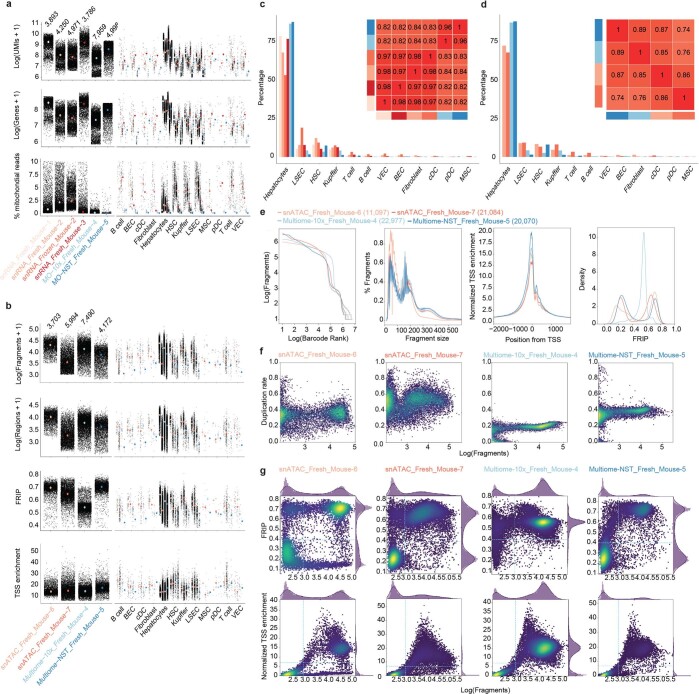
Extended Data Fig. 1. Single cell omics data quality control.
a. Dot plot showing the log number of UMIs (before normalization), the log number of expressed genes and the ratio of mitochondrial reads per sample and cell type for the snRNA-seq and multiome samples. The number of cells per sample is indicated on top of the dot plots. The median of each distribution is indicated with a coloured dot. b. Dot plot showing the log10(number of fragments), the log10(number of accessible regions), the Fraction of Reads in Peaks (FRIP), and the normalized TSS enrichment per sample and cell type for the snATAC-seq and multiome samples. The number of cells per sample is indicated on top of the dot plots. The median of each distribution is indicated with a coloured dot. c. Bar plot showing the percentage of cells corresponding to each cell type across samples and correlation between normalized gene expression values (as bulk) across samples for the snRNA-seq and multiome samples. d. Bar plot showing the percentage of cells corresponding to each cell type across samples and correlation between normalized region accessibility values (as bulk) across samples for the snATAC-seq and multiome samples. e. Sample-level epigenome quality control, including (in order top to bottom): barcode rank plot, insert size distribution, TSS enrichment and Fraction of Reads In Peaks (FRIP). f. Duplication rate per barcode versus log number of fragments per sample. g. Fraction of Reads in Peaks (FRIP, top) and Normalized TSS enrichment (bottom) per barcode per sample. The blue dotted lines indicate the minimum threshold in FRIP, number of fragments and TSS enrichment to select high quality cells. BEC: biliary epithelial cells, cDC: conventional dendritic cell, HSC: hepatic stellate cells, MSC: mesothelial cells, pDC: plasmacytoid dendritic cell, VEC: vascular endothelial cells. Source numerical data are available in source data.

