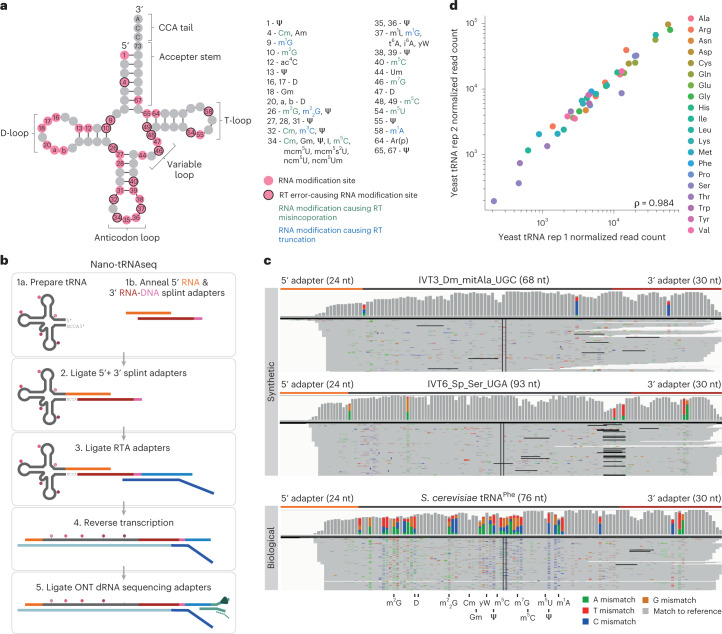
Fig. 1. Nano-tRNAseq can efficiently sequence both IVT and native tRNA populations.
a, Schematic of the modifications found in S. cerevisiae cytoplasmic tRNA, shown in its usual secondary structure form with circles representing nucleotides and lines representing base pairs. Gray circles represent unmodified nucleotides; pink circles represent possible modification sites; and those with a black outline indicate modifications that cause errors during reverse transcription. Possible RNA modifications occurring at each position are listed in the surrounding boxes; modifications that cause misincorporation during reverse transcription are in green; and those that cause reverse transcription truncation are in blue. b, Schematic overview illustrating the steps required for tRNA library preparation using Nano-tRNAseq (see Extended Data Fig. 1 for more details). c, IGV snapshots of Nano-tRNAseq mapped reads from synthetic IVT tRNAs (upper panels) or biological tRNAs (lower panel). Positions with a mismatch frequency greater than 0.2 are colored, whereas those showing mismatch frequencies lower than 0.2 are shown in gray. d, Scatter plot of tRNA abundances showing the replicability of Nano-tRNAseq when WT S. cerevisiae tRNA biological replicates are sequenced. The correlation strength is indicated by Spearman’s correlation coefficient (ρ). RT, reverse transcription.

