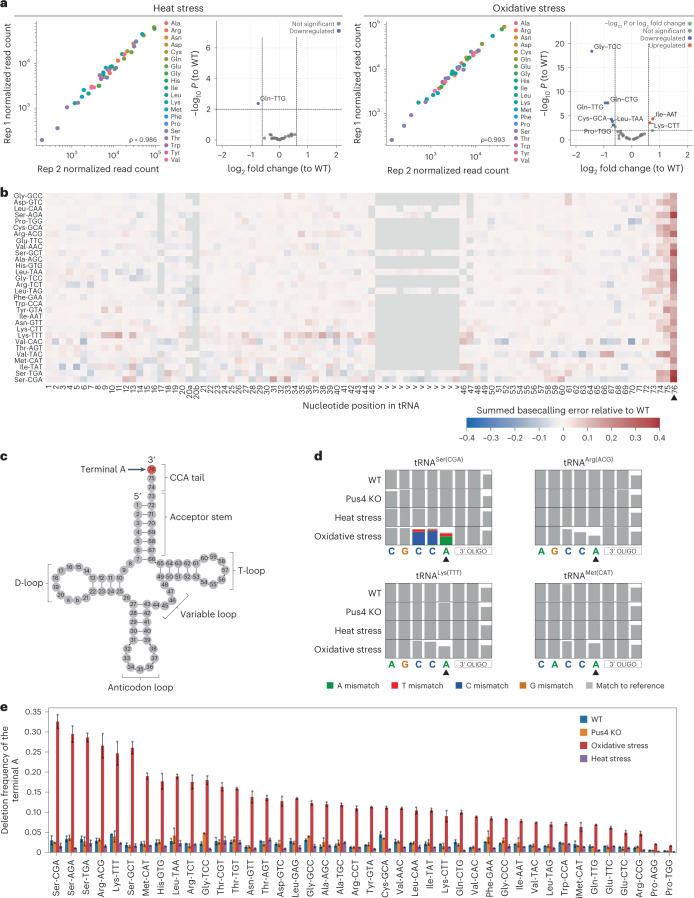
Fig. 5. Characterization of tRNA abundance and modification dynamics upon exposure to stress reveals that the CCA tail is deadenylated in oxidative stress.
a, Scatter plots of tRNA abundances of S. cerevisiae heat stress (45 °C for 1 hour) and oxidative stress (2 mM H202 for 1 hour) across biological replicates. Each point represents a tRNA alloacceptor and is colored based on alloacceptor type. The correlation strength is indicated by Spearman’s correlation coefficient (ρ). See also Supplementary Table 21. Volcano plots depicting differentially expressed tRNAs (relative to the untreated condition) are also shown for each stress type. See also Supplementary Tables 22 and 23. Differentially expressed tRNAs were defined as having an adjusted log10 P < 0.01 and an absolute log2 fold change greater than 0.6. b, Heat map of summed basecalling error of oxidative stress relative to WT, for each nucleotide (x axis) and for each tRNA (y axis, ordered from most to least abundant in descending order). See also Supplementary Table 17. The positions of specific RNA modifications in each tRNA are listed in Supplementary Table 18. Nucleotides with a lower summed basecalling error frequency relative to WT are in blue tones, and those with a higher summed basecalling error frequency are in red tones, as seen with the terminal A at position 76 (black arrowhead). Heat maps corresponding to other biological replicates can be found in Supplementary Fig. 2b. c, Schematic of a generic S. cerevisiae cytoplasmic tRNA in its usual secondary structure with the terminal A nucleotide of the CCA tail highlighted in red. d, Zoomed snapshots of IGV tracks featuring the terminal A (black arrowhead). Positions with a mismatch frequency greater than 0.2 are colored, whereas those showing mismatch frequencies lower than 0.2 are shown in gray. e, Bar plot of the deletion frequency of the terminal A base for each S. cerevisiae tRNA isoacceptor under oxidative stress (red), Pus4 KO (orange) or heat stress (purple) or in WT conditions (blue) (Supplementary Table 24). Error bars represent mean ± s.d. for n = 2 biological replicates per condition.

