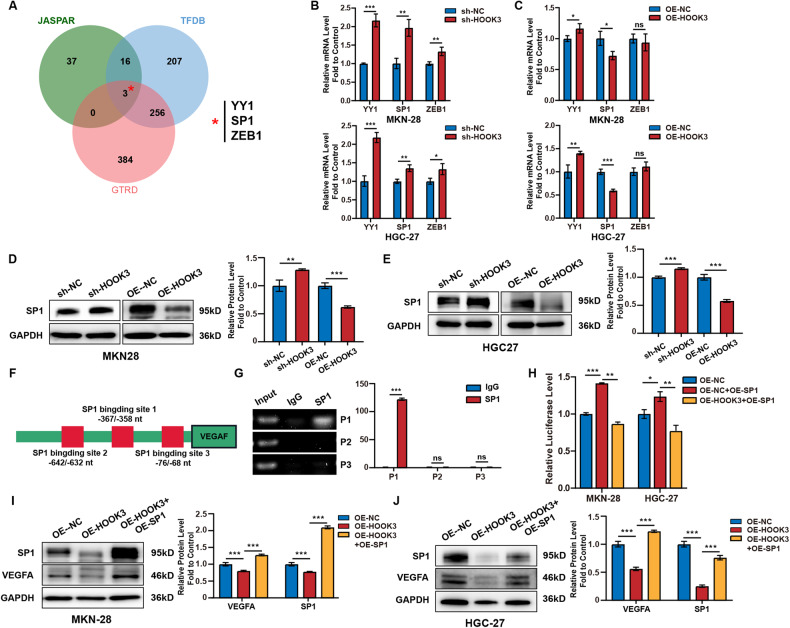
Fig. 5. HOOK3 inhibited VEGFA expression via SP1.
A The intersection of transcription factors predicted by three databases, GTRD (red circle), JASPAR (green circle), and TFDB (blue circle), was analyzed. B The expression of YY1, SP1, and ZEB1 was analyzed by RT-qPCR in HOOK3 knockdown MKN-28 and HGC-27 cells. C The expression of YY1, SP1, and ZEB1 was analyzed by RT-qPCR in HOOK3-overexpressing MKN-28 and HGC-27 cells. D Western blot analysis was performed to evaluate the expression of SP1 in either HOOK3 knockdown or HOOK3-overexpressing MKN-28 cells. GAPDH was used as the control. The band densities from Western blot were quantified using the ImageJ program. E Western blot analysis was performed to evaluate the expression of SP1 in either HOOK3-knockdown or HOOK3-overexpressing HGC-27 cells. GAPDH was used as the control. The band densities from Western blot were quantified using the ImageJ program. F A schematic diagram illustrating the presence of three SP1 binding sites (P1: −367nt to −358nt, P2: −642nt to −632nt, and P3: −76nt to −68nt) in the 5′ region of the VEGFA promoter. G ChIP analysis was conducted to assess the binding of SP1 to the VEGFA promoter in MKN-28 cells. Normal rabbit IgG was used as the control. H The luciferase activity, responsive to SP1, was measured in MKN-28 and HGC-27 cells transfected with HOOK3 overexpressing plasmid and SP1 overexpressing plasmid. I Western blot analysis was performed to evaluate the expression of VEGFA and SP1 in HOOK3-overexpressing MKN-28 cells transfected with SP1 overexpression plasmid. GAPDH was used as the control. The band densities from Western blot were quantified using the ImageJ program. J Western blot analysis was performed to evaluate the expression of VEGFA and SP1 in HOOK3-overexpressing HGC-27 cells transfected with SP1 overexpression plasmid. GAPDH was used as the control. The band densities from Western blot were quantified using the ImageJ program. The experiments were conducted in triplicate. The mean values with standard deviation (SD) were presented, and the statistical significance was determined using Student’s t-test. Nonsignificant results were denoted as “ns”, while significance levels were shown as *P < 0.05, **P < 0.01, and ***P < 0.001.

