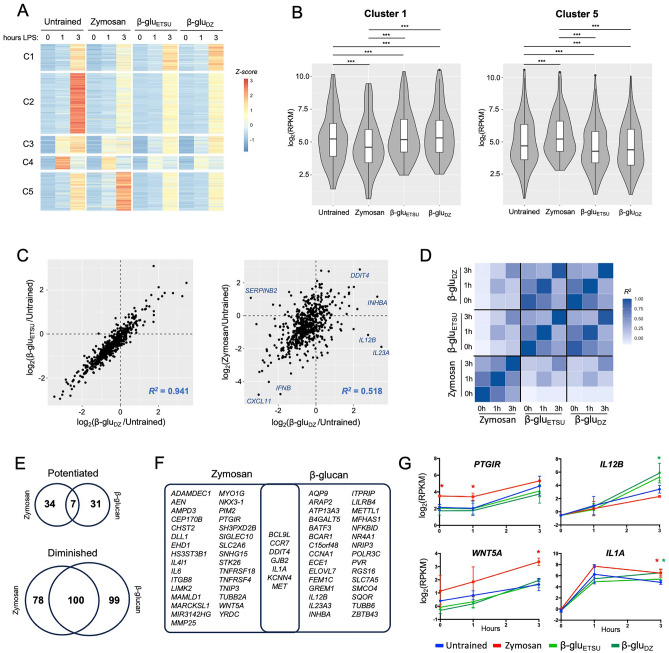
Figure 2.
Training with zymosan and β-glucans induce different transcriptomic responses to LPS. (A) Heat map of 603 genes induced by LPS over a 3-h time course in macrophages trained with the indicated ligands; average of two replicates; k-means clustering showing five distinct clusters. (B) Box and violin plots of RPKM at 3 h for genes in Cluster 1 and Cluster 5; *** p < 0.001 by paired t-test. (C) Scatterplots comparing log fold-change of trained versus untrained RPKM at 3-h LPS timepoint; training effect of two types of β-glu are strongly correlated with each other (left), but weakly correlated with zymosan effects (right). (D) Heat map of correlation coefficients between conditions using the same analytical approach as (C). (E) Venn diagrams of the number of genes showing potentiated or diminished LPS response after training with Zymosan or either β-glucan, using statistical threshold of p < 0.05 and log fold-change > 0.5. (F) Venn diagram of genes with potentiated LPS response after training. (G) Expression of representative genes potentiated by Zymosan (PTGIR, WNT5A), β-glucan (IL12B), or both (IL1A); error bars = standard deviation, * = p < 0.05 in condition indicated by color.

