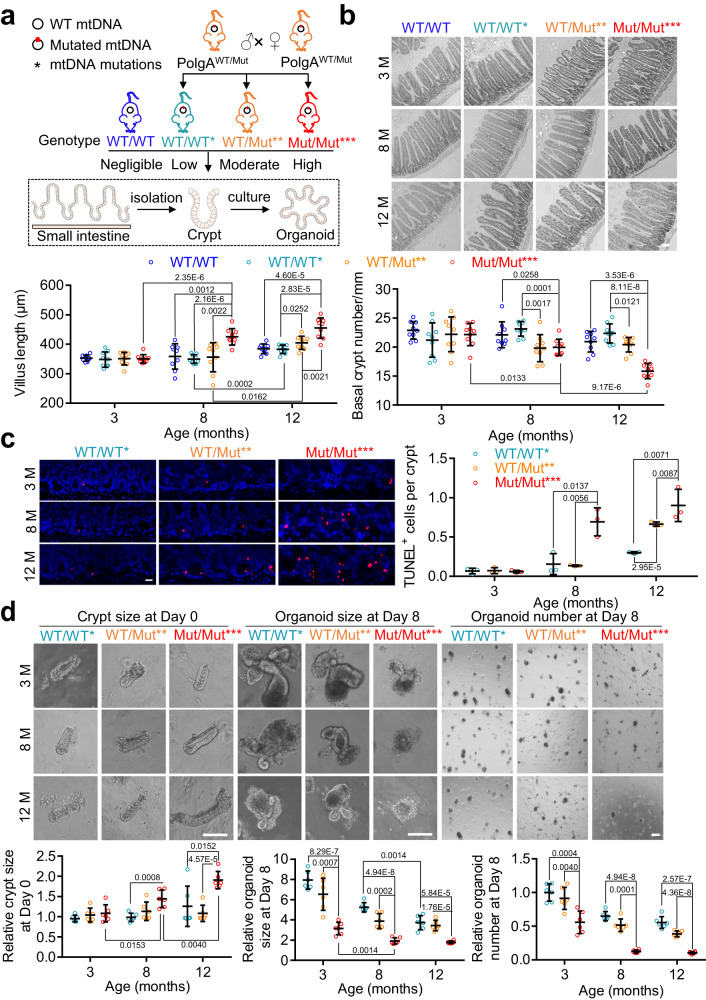
Fig. 1. Increased mtDNA mutation burden induces an aging-like phenotype in the small intestine.
a Diagram depicting the experimental methods for detecting the changes of small intestine and organoids derived from isolated crypts in the mice with four categories of mtDNA mutation burden at 3, 8, and 12 month. The figures of small intestine, intestinal crypt, and organoids were generated with the help of Servier Medical Art, provided by Servier, licensed under a Creative Commons Attribution 4.0 unported license (https://creativecommons.org/licenses/by/4.0/deed.en). PolgAWT/Mut (WT/Mut**) mice were crossed to generate three types of offspring with a theoretically maternally transmitted mtDNA mutations, i.e. PolgAWT/WT (WT/WT*), PolgAWT/Mut (WT/Mut**) and PolgAMut/Mut (Mut/Mut***). PolgAWT/WT mice with negligible level of mtDNA mutations (WT/WT) were used as an additional control. b Representative images of small intestine stained with H&E in WT/WT, WT/WT*, WT/Mut**, and Mut/Mut*** mice at 3, 8, and 12 months of age (Scale bar, 100 μm). The villus length and number of crypts per millimeter of small intestine are quantified below (Data are presented as the mean ± S.D of 9 intestinal segments from 3 mice per group; two-way ANOVA test). c Representative images of intestinal crypts stained with TUNEL in WT/WT*, WT/Mut**, and Mut/Mut*** mice at 3, 8, and 12 months of age (Scale bar, 20 μm). Since no difference was observed during intestinal aging between WT/WT and WT/WT*, WT/WT* mice was used a control. The number of TUNEL-positive cells per crypt is quantified on right (Data are presented as the mean ± S.D and n = 3 mice per group; two-way ANOVA test). d Representative crypt images at Day 0 and organoids at Day 8 in the intestine of WT/WT*, WT/Mut**, and Mut/Mut*** mice at 3, 8, and 12 months of age (Scale bar, 100 μm). Crypt size, organoid size and relative organoid number per well were quantified. Average organoid number per well was normalized to WT/WT* at 3 months. Data are presented as the mean ± S.D of 6 wells from 3 mice per group; two-way ANOVA test. Source data are provided with this paper.

