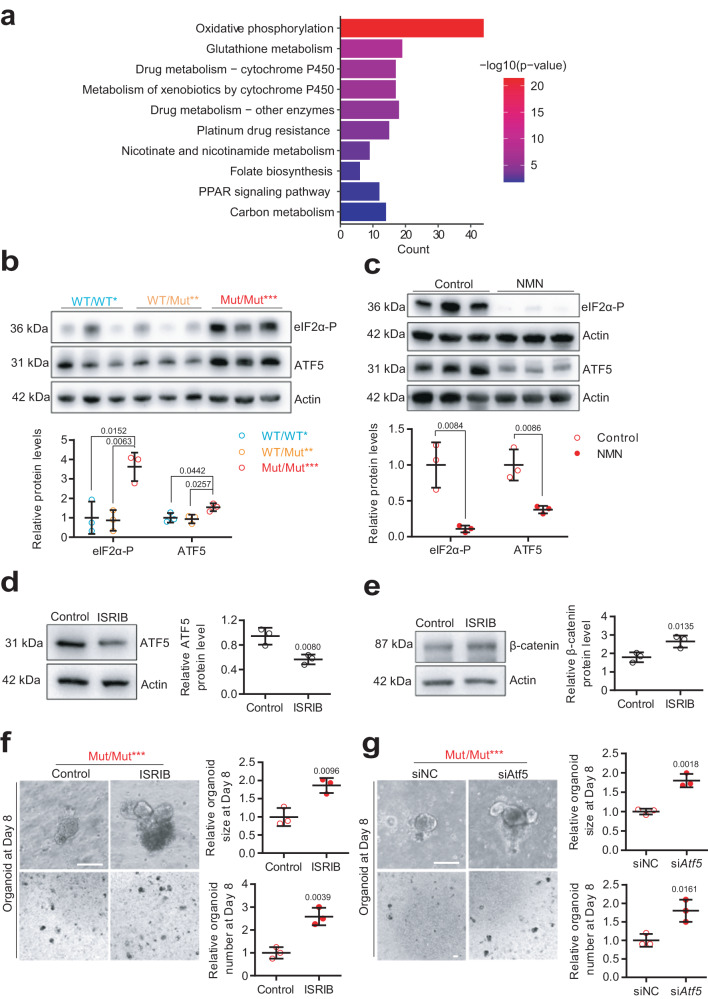
Fig. 6. NAD+ depletion activates ISR to regulate mtDNA mutation-induced aging phenotypes through impaired Wnt/β-catenin signaling.
a Kyoto Encyclopedia of Genes and Genomes pathway enrichment of differentially upregulated genes in Mut/Mut*** mice at 8 months of age versus WT/WT* mice was performed using clusterProfiler package, and significance was determined by Fisher exact test of adjusted p-value by BH method (n = 3 mice per group). b Protein expression of eIF2α-P and ATF5 by western blot analysis in the intestinal crypts of WT/WT*, WT/Mut** and Mut/Mut*** mice at 8 months of age. Relative band densities quantified using ImageJ are shown at bottom (Data are presented as the mean ± S.D and n = 3 mice per group; one-way ANOVA test). c Protein expression of eIF2α-P and ATF5 by western blot analysis in the intestinal crypts of Mut/Mut*** mice treated with NMN or water. Relative band densities quantified using ImageJ are shown at bottom (Data are presented as the mean ± S.D and n = 3 mice per group; one-way ANOVA test). d Protein expression of ATF5 by western blot analysis in Mut/Mut*** intestinal crypt cells treated with Control or ISRIB. Relative band densities quantified using ImageJ are shown on right (Data are presented as the mean ± S.D and n = 3 mice per group; paired two-tailed Student’s t-test). e Protein expression of β-catenin by western blot analysis in Mut/Mut*** intestinal crypt cells treated with ISRIB or control. Relative band densities quantified using ImageJ are shown on right (Data are presented as the mean ± S.D and n = 3 mice per group; paired two-tailed Student’s t-test). f Representative organoid images at Day 8 from the intestinal crypts of Mut/Mut*** mice at 8 months of age with 500 nM ISRIB or water control (Scale bar, 100 μm). Organoid size and relative organoid number per well are quantified on right, and the average organoid number per well is normalized to the control. (Data are presented as the mean ± S.D and n = 3 mice per group; unpaired two-tailed Student’s t-test) g Representative organoid images at Day 8 from the intestinal crypts of Mut/Mut*** mice at 8 months of age with siAtf5 or control siNC (Scale bar, 100 μm); organoid size and relative organoid number per well are quantified at bottom. Average organoid number per well is normalized to the control. Data are presented as the mean ± S.D and n = 3 mice per group; unpaired two-tailed Student’s t-test. Source data are provided with this paper.

