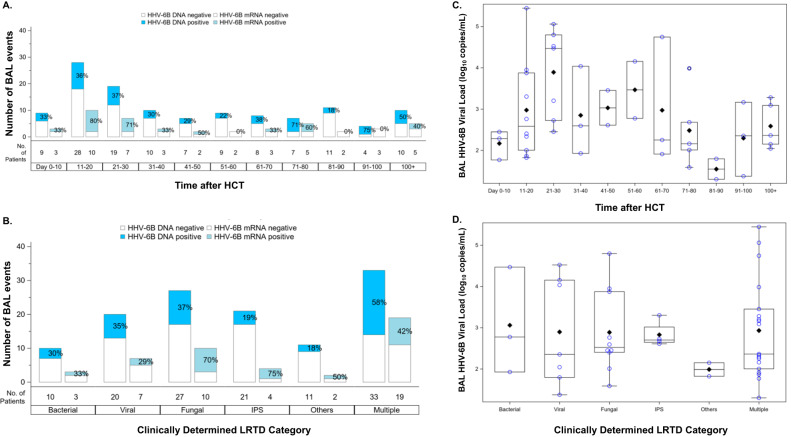
Fig. 2. The distribution of BALF HHV-6B DNA and mRNA detection over time and by LRTD category.
Panels (A) and (B) show data from 122 BAL events in 113 participants. The first bar in each time period or category indicates the proportion of BALs with HHV-6B DNA detection; the second bar indicates the proportion with HHV-6B mRNA detection, among those with HHV-6B DNA detection (samples without HHV-6B DNA detection were not tested for mRNA). Panels (C) and (D) show data from 45 BAL events (in 42 participants) that had HHV-6B DNA detection. The boxes represent the interquartile range, the horizontal lines and diamonds within the boxes represent the median and mean, respectively, and the upper and lower whiskers extend to the third and first quartiles plus or minus 1.5 times the interquartile range, respectively. Circles represent data points. LRTD indicates lower respiratory tract disease.

