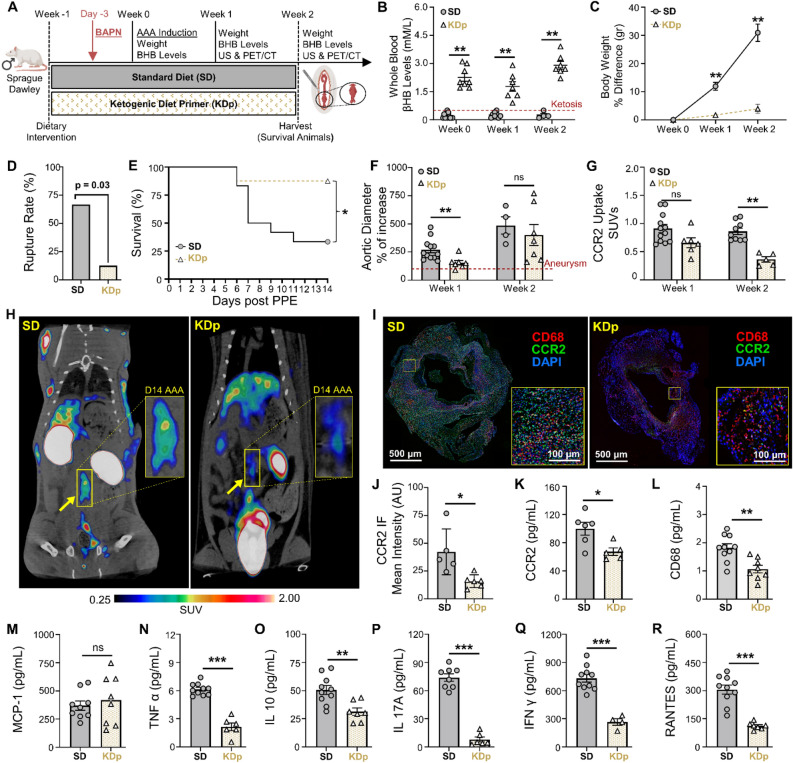
Figure 2.
Sustained ketosis reduces AAA expansion and risk of rupture via CCR2 downregulation and Collagen 1 preservation. (A) Rats underwent exposure to PPE to develop AAAs and were also treated with β-aminoprionitrile (BAPN) to promote AAA rupture. (B) Ketosis (βHB whole blood levels > 0.5 mM/L) in SD and KDp rats at week 0 (0.2 ± 0.1 vs. 2 ± 0.5), week 1 (0.3 ± 0.1 vs. 1.8 ± 0.7) and week 2 (0.2 ± 0.1 vs. 3 ± 0.5; p < 0.01). (C) Percent body weight difference in SD and KDp rats at week 1 (12 ± 5 vs. 2 ± 1.3; p < 0.001) and week 2 (31 ± 6 vs. 4 ± 3; p = 0.006). (D) AAA rupture event rate with statistical analysis in SD and KDp rats (p = 0.03). (E) Kaplan–Meier curve demonstrating rate of survival following BAPN administration. 67% (8/12) of SD rats and 12% (1/8) KDp rats developed AAA rupture. (F) Percent aortic diameter in SD and KDp rats at week 1 (270 ± 93 vs. 154 ± 53; p = 0.002) and week 2 (485 ± 153 vs. 401 ± 246; p = ns). (G) Quantitative tracer uptake of CCR2 content in AAA tissue for SD and KDp rats at week 1 (0.9 ± 0.2 vs. 0.7 ± 0.2; p = 0.05) and week 2 (0.9 ± 0.2 vs. 0.4 ± 0.1; p < 0.001. (H) Representative PET/CT coronal images at day 14 post PPE exposure showed specific and intensive detection of AAA (yellow rectangle) in SD, compared with the low trace accumulations in the KDp group of rats. (I) Immunofluorescence staining of abdominal aortas (cross-sectional; 5× magnification and 10× magnification) marked with CCR2 (in green: CCR2 + cells) and CD68 marker (in red: CD68+ cells; macrophages) to visualize inflammatory cells infiltration within the AAA. (K) CCR2 concentration at week 1 in AAA tissue of SD and KDp rats (100 ± 22 vs. 67 ± 12; p = 0.02). (K) Macrophage marker CD68 content at week 1 in AAA tissue of SD and KDp rats (1.8 ± 0.4 vs. 1 ± 0.4; p = 0.002). (L) Chemokine MCP-1 content (3.7 ± 1.2 × 10² vs. 4.2 ± 2.2 × 10²; p = ns). (M) Pro-inflammatory marker TNFα content (6.1 ± 0.6 vs. 2.1 ± 1; p = 0.001), (N) IL-10 content (5 ± 1.3 × 101 vs. 3.1 ± 0.9 × 101; p = 0.03), (O) IL-17A content (7.4 ± 1.1 × 101 vs. 0.8 ± 0.6 × 101; p < 0.001), (P) IFNγ content (7.3 ± 1.3 × 10² vs. 2.6 ± 0.7 × 10²; p = 0.002), (Q) RANTES content (3 ± 0.7 × 10² vs. 1.1 ± 0.2 × 10²; p < 0.001). Data presented as mean ± standard deviation. ns > 0.05, *p < 0.05, **p < 0.01, ***p < 0.001 using Student’s t test.

