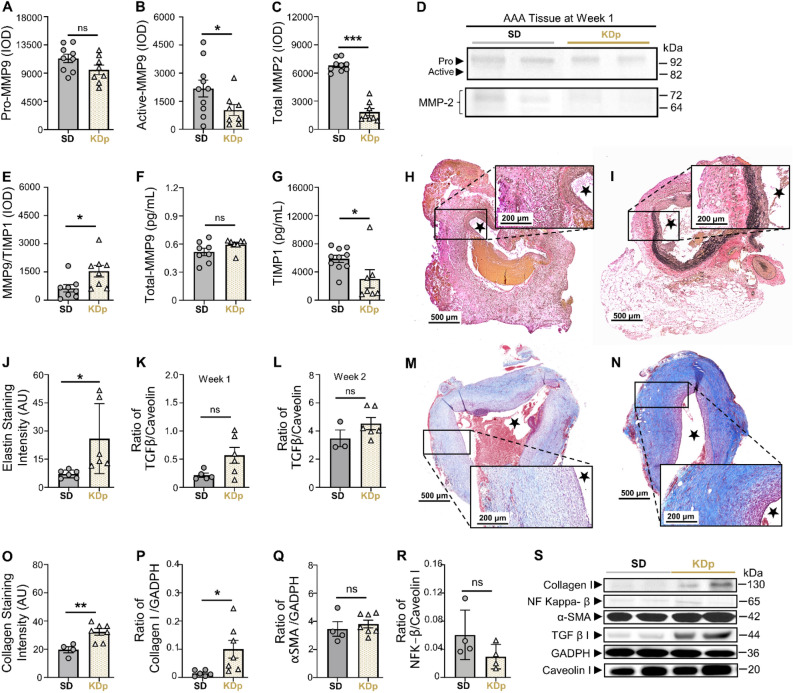
Figure 3.
Sustained ketosis downregulates CCR2 content and inhibit its downstream signals. (A) Pro MMP9 levels at week 1 in AAA tissue of SD and KDp rats (11.3 ± 2 × 10³ vs. 9.5 ± 2.1 × 10³; p = ns). (B) Active MMP9 levels in AAA tissue of SD and KDp rats (2.1 ± 1.4 × 10³ vs. 0.9 ± 0.7 × 10³; p = 0.04). (C) Total MMP2 levels in AAA tissue of SD and KDp rats (7 ± 0.7 × 10³ vs. 1.8 ± 1 × 10³; p < 0.001). Pro and active MMP9 and total MMP2 levels were measured by integrated optical density (IOD). (D) Representative zymogram from AAA tissue homogenates at week 1 demonstrating pro and active MMP-9 and total MMP-2 levels in SD and KDp rats (E) MMP9/TIMP1 complex levels in AAA tissue of SD and KDp rats (6.3 ± 5 × 10² vs. 15 ± 8.7 × 10²; p = 0.02). ELISA of AAA tissue homogenates in SD and KDp rats provided levels of (G) Total MMP9 (5 ± 1.1 × 10⁻¹ vs. 6 ± 0.6 × 10⁻¹; p = ns), (H) SD AAA tissue harvested at day 6 (week 1) stained with VVG at 10× and 5× magnification respectively. TIMP 1 (5.9 ± 1.6 × 10³ vs. 3.4 ± 3 × 10³; p = 0.03). (I) KD AAA tissue harvested at day 6 (week 1) stained with VVG at 10× and 5× magnification respectively. (J) AAA VVG-staining quantification for SD and KDp at week 1 (7 ± 2 vs. 26 ± 18 respectively; p = 0.03). (K) TGFβ-1 protein content expressed as a ratio to Caveolin 1 content in AAA tissue from SD and KDp rats at week 1 (2.2 ± 0.8 × 10⁻¹ vs. 5.7 ± 3.4 × 10⁻¹; p = 0.2). (L) TGFβ-1 protein content expressed as a ratio to Caveolin 1 content in AAA tissue from SD and KDp rats at week 2 (0.3 ± 0.1 vs. 0.5 ± 0.1; p = ns). (M and N) Trichrome staining of abdominal aortas (cross-sectional) with 5× magnification and 10× magnification in SD and KDp rats to visualize collagen deposition in animal aortic tissue. (O) AAA collagen staining quantification for SD and KDp at week 2 (20 ± 4 vs. 32 ± 6; p = 0.006). (P) Collagen 1 protein content expressed as a ratio to GAPDH content in AAA tissue at week 2 for SD and KDp rats (1.5 ± 1.0 × 10⁻² vs. 10 ± 8.2 × 10⁻², p = 0.03). (Q) α-SMA protein content expressed as a ratio to GAPDH content in AAA tissue of SD and KDp rats (3.4 ± 1 vs. 3.8 ± 0.7; p = ns). (R) NF Kappa β protein content expressed as a ratio to Caveolin I content in AAA tissue of SD and KDp rats (0.06 ± 0.03 vs. 0.03 ± 0.01; p = ns). (S) Representative Western blots of collagen 1, NF Kappa β, α-SMA, TGFβ-1, GAPDH and Caveolin 1 in AAA tissue. Data presented as mean ± standard deviation. ns > 0.05, *p < 0.05, **p < 0.01, ***p < 0.001 using Student’s t test.

