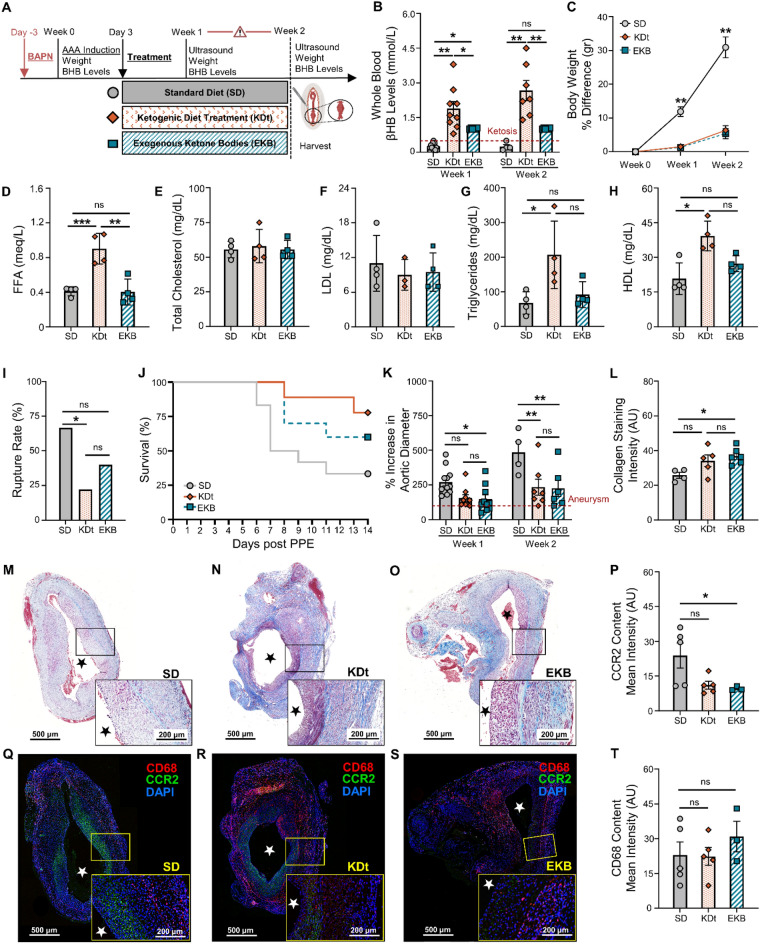
Figure 4.
Impact of therapeutic ketosis on AAA risk of rupture. (A) Rats underwent exposure to PPE to develop AAAs and were also treated with BAPN to promote AAA rupture. Following AAA induction, rats received a ketogenic ‘treatment’ via an oral diet (KDt) or exogenous supplement (EKB). (B) Ketosis (βHB whole blood levels > 0.5 mM/L) in SD, KDt, and EKB rats at week 1 (0.2 ± 0.1, 1.8 ± 0.9 and 1 ± 0.02, respectively; p < 0.05) and at week 2 (0.2 ± 0.1, 2.7 ± 1.1, and 1 ± 0.02 respectively; p < 0.01) analyzed using two-way ANOVA. (C) Percent body weight difference for SD, KDt, and EKB rats at week 1 (11 ± 4, 2.5 ± 1.4, and 2.4 ± 1.3, respectively; p < 0.01) and at week 2 (31 ± 6, 6 ± 3.5, and 5 ± 3.6, respectively; p < 0.01) analyzed using two-way ANOVA. (D) Free fatty Acids (FFA) serum levels in meq/L in rats fed SD (0.41 ± 0.05) versus KDp (0.86 ± 0.06; p = 0.001), KDt (0.9 ± 0.1 p = 0.005) and EKB (0.40 ± 0.1; p = ns) respectively. (E) Total Cholesterol serum levels in meq/L in rats fed SD (55.5 ± 6) versus KDp (57.5 ± 10; p = ns), KDt (58 ± 12; p = ns) and EKB (55.5 ± 7; p = ns) respectively. (F) Low-density lipoprotein (LDL) serum levels in meq/L in rats fed SD (11 ± 5) versus KDp (9 ± 2; p = ns), KDt (9 ± 3; p = ns) and EKB (9.5 ± 3; p = ns) respectively. (G) Triglycerides serum levels (meq/L) in rats fed SD (68 ± 32) versus KDp (112 ± 51; p = ns), KDt (206 ± 97; p = 0.01) and EKB (92 ± 37; p = ns) respectively. (H) High-density lipoprotein (HDL) serum levels (meq/L) in rats fed SD (21 ± 7) versus KDp (26 ± 6; p = ns), KDt (39 ± 6; p = 0.01) and EKB (27 ± 3; p = ns) respectively. (I) AAA rupture event rate in SD, KDt and EKB rats (p < 0.05 between SD and KDt) using survival analysis. (J) Kaplan–Meier curve demonstrating survival following BAPN administration. 67% (8/12) of SD rats, 40% (2/9) of KDt rats (p = 0.03), and 22% (4/10) of EKB rats (p = ns) developed AAA rupture by week 2. (K) Percent aortic diameter at week 1 in SD versus KDt rats (270 ± 94 and 155 ± 73; p = 0.06), and SD versus EKB rats (148 ± 94; p = 0.04). At week 2, in SD versus KDt rats (485 ± 153 and 234 ± 151; p < 0.01), and SD versus EKB rats (227 ± 147; p < 0.01 analyzed using two-way ANOVA. (L–O) Trichrome staining of AAA tissue at 5× and 10× magnifications to demonstrate collagen deposition in SD versus KDt rats (26 ± 3 and 34 ± 8; p = ns), and SD versus EKB rats (37 ± 5; p = 0.02) analyzed using one-way ANOVA. (P) CCR2 ELISA content in AAA tissue of SD versus KDt rats (5.7 ± 4 and 4.6 ± 3; p = ns), and SD versus EKB rats (4.7 ± 3; p = ns). (Q–S) Immunofluorescent staining of AAA tissue at 5× and 10× magnifications to demonstrate CD68, CCR2, and DAPI positive cells. (T) Immunofluorescent intensity of CD68 was analyzed using one-way ANOVA between SD, KDt, and EKB groups. Data presented as mean ± standard deviation. ns > 0.05, *p < 0.05, **p < 0.01, ***p < 0.001 using one-way ANOVA, or two-way ANOVA with multiple comparison.

