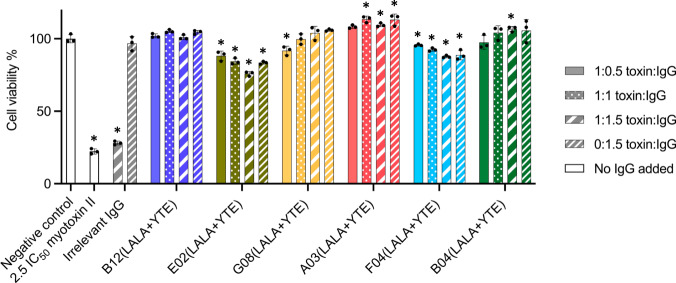
Fig. 3. In vitro neutralization of myotoxin II induced cell cytotoxicity by six different IgGs.
Six IgGs were tested at three toxin:IgG ratios to check for myotoxin II (72.5 µg per well) neutralizing abilities in an in vitro fibroblast viability assay. Assay controls included a negative control (PBS), a positive control (toxin challenge without IgG), an irrelevant IgG (a non-myotoxin II binding IgG) at toxin:IgG ratios of 1:1.5 and 0:1.5, and an IgG only control for each tested IgG (0:1.5 toxin:IgG ratio). Experiments were performed in triplicates (n = 3) and reported as means normalized to the negative control. Asterisks (*) note statistical difference (p < 0.05) compared to the negative control (PBS), error bars represent the SD and dots represent individual data points. Statistics were carried out by comparing each condition to the negative control (PBS) using a one-way ANOVA, followed by Dunnett’s multiple comparison test. Source data are provided in a Source Data file, which includes exact p-values and confidence intervals.

