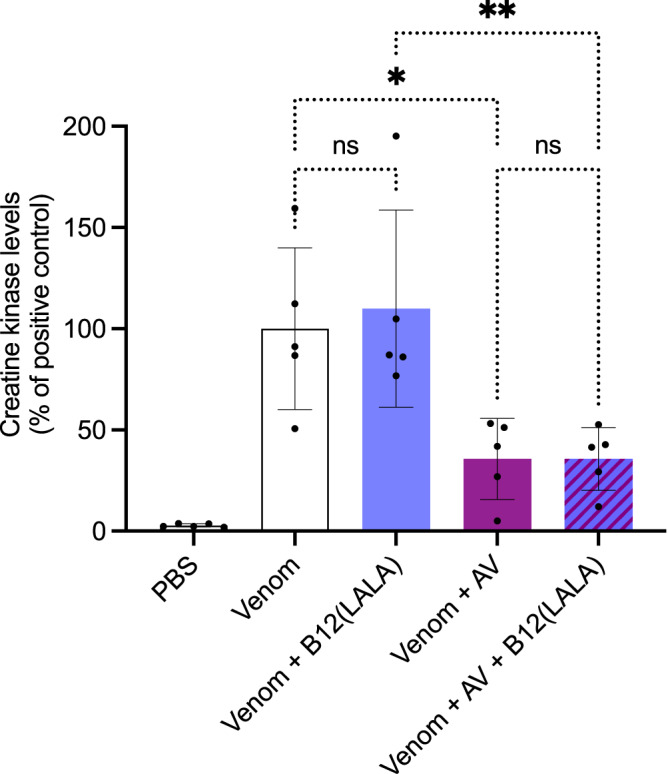
Fig. 8. In vivo rescue assays using a different IgG scaffold.

The graph illustrates in vivo muscle damage caused by B. asper venom measured as increased creatine kinase (CK) levels. B. asper whole venom (Venom) was injected i.m. and 3 min later antibody/antivenom (B12(LALA)/AV) or PBS was injected i.v. in mice. After 3 h, the mice were bled, and CK levels were measured. The CK levels have been normalized to the positive control (Venom) for graph consistency and are reported as means with error bars representing the SD (n = 5 mice) and dots representing individual data points. Asterisks (*p-value < 0.05, **p-value < 0.01) note significant statistical difference, ns represents a non-significant p-value (>0.05) Statistics were carried out on preselected groups using one-way ANOVA followed by Šídák’s multiple comparison test. Source data are provided in a Source Data file which includes exact p-values and confidence intervals.
