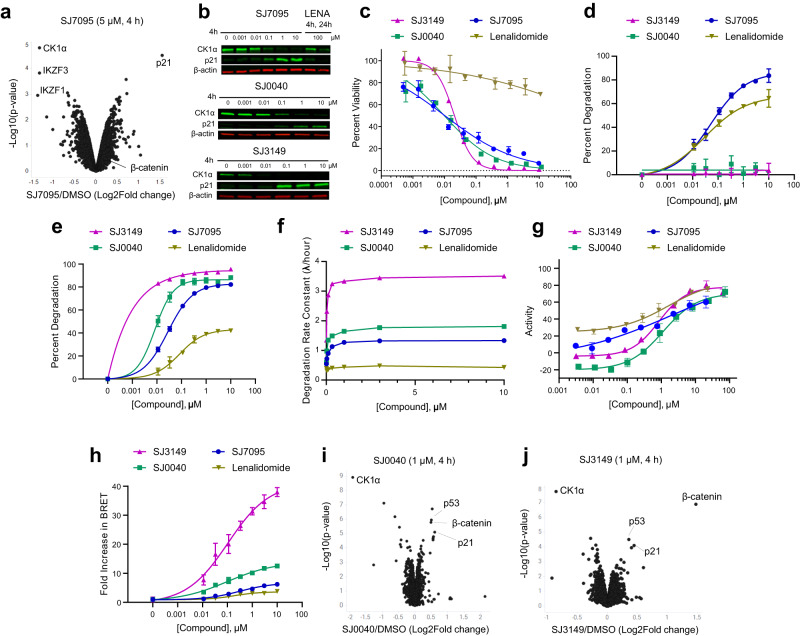
Fig. 2. Degradation profiles of hit and leads.
a TMT-Proteomics in MOLM-13 cells following 4 h treatment with SJ7095 at 5 µM concentration. b CK1α and p21 protein levels in MOLM-13 cells determined by immunoblotting following treatment with increasing concentrations of test compounds over 4 h, and lenalidomide at 100 μM over 4 and 24 h. The CK1α DC50 values were calculated using quantified band intensities from the immunoblotting analysis. Data represents the average from three independent experiments. c Viability of MOLM-13 cells measured in the CTG assay after 72 h incubation with rising concentrations of the tested compound. d IKZF1 degradation maximum (Dmax) as determined by IKZF1 HiBiT assay. e CK1α degradation maximum (Dmax) as determined by CK1α HiBiT assay. f CK1α degradation rate as determined by CK1α HiBiT assay. g CRBN-binding affinity determined in the fluorescence polarization (FP) displacement assay. h Ternary complex formation measured in CK1α-CRBN NanoBRET assay. TMT-Proteomics in MOLM-13 cells following 4 h treatment with 1 µM concentration of: i SJ0040 and j SJ3149. Data represents the average of at least three independent determinations. Error bars represent the standard error of the mean. Statistical analysis for a, i, j: two-tailed and unpaired t-test. Data in Fig. 2 are summarized in Supplementary Table 1.

