Fig. 4.

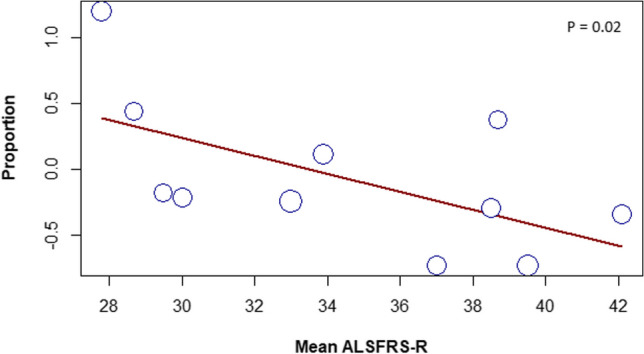
Random-effects meta-regression chart of the association between the frequency of fatigue and ALSFRS-R mean. Every circle represents a study, and the size of the circle represents the weight of the study in the analysis

Random-effects meta-regression chart of the association between the frequency of fatigue and ALSFRS-R mean. Every circle represents a study, and the size of the circle represents the weight of the study in the analysis