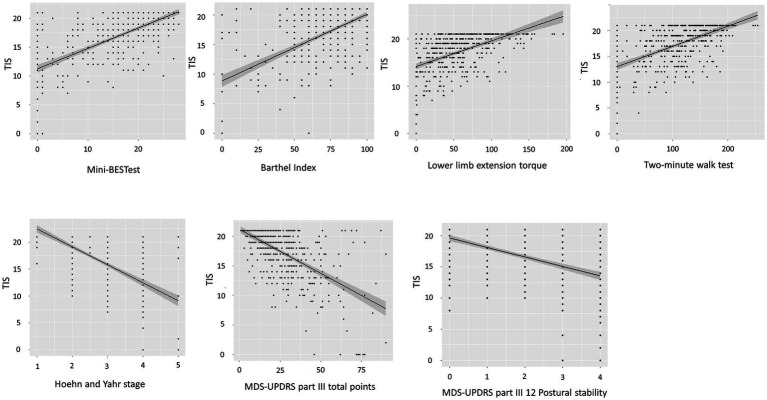
Figure 2.
Scatter plots depicting the relationship between the TIS and associated assessment parameters. Spearman‘s correlation coefficients show a positive association of the TIS (range 0–21 points) and Mini-BESTest (range 0–28 points). Spearman’s correlation coefficients show negative associations of the TIS (range 0–21 points) and Hoehn and Yahr stage (range 1–5) and MDS-UPDRS part III total points (range 0–132 points). TIS, Trunk Impairment Scale; Mini-BESTest, Mini-Balance Evaluation Systems Test; MDS-UPDRS, Movement Disorders Society-unified Parkinson’s disease rating scale.

