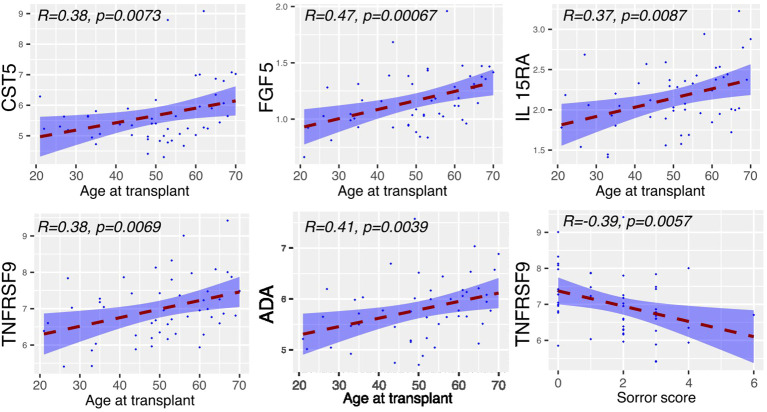
Figure 2.
Serum proteins at Day 0 displaying correlation with clinical covariates. Relative concentration of serum proteins is shown on the y-axis and correlated with patient age, mononuclear cell dose, Sorror score and T cell dose. Significant protein-clinical variable correlations are shown with absolute correlation coefficient (R) > 0.2 (p<0.01). Dashed line represents the linear model fit to the data points with shading for 95% confidence interval.

