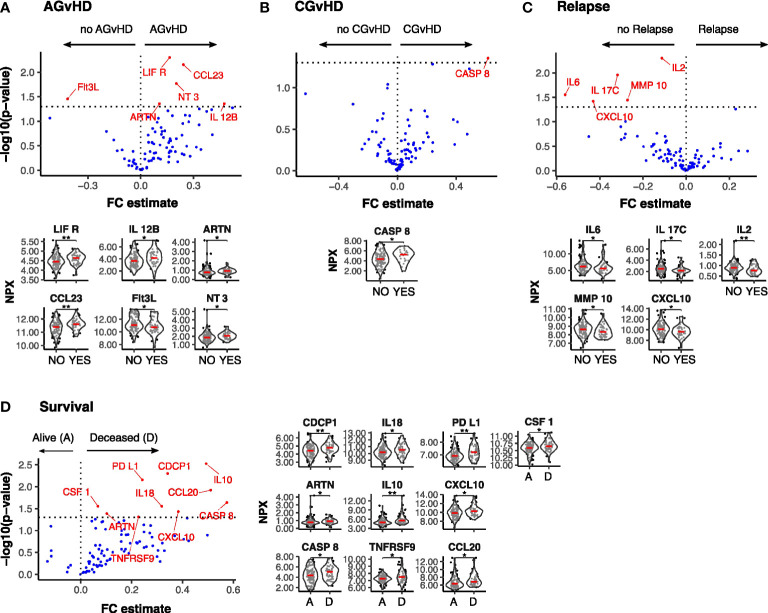
Figure 5.
Differentially expressed serum protein markers at Day-14 post SCT by clinical outcome. Results of Univariate testing of Day 14 serum protein levels stratified by clinical outcomes Acute GvHD: Yes (44) vs No (105) (A); Chronic GvHD: Yes (22) vs No (122) (B); Relapse: Yes (44) vs No (105) (C); Survival: Deceased (D) (52) vs Alive (A) (100) (D). Proteins labelled in red showed a significant difference (p<0.05) by Man Whitney after Benjamini-Hochberg (BH) multiple testing correction. FC estimate is calculated as -1*(median difference between samples from eac distribution). Violin plots of Normalised Protein eXpression (NPX) are shown for the proteins found to be differentially expressed for each clinical outcome. (BH corrected p≤0.01**; p≤0.05*).

