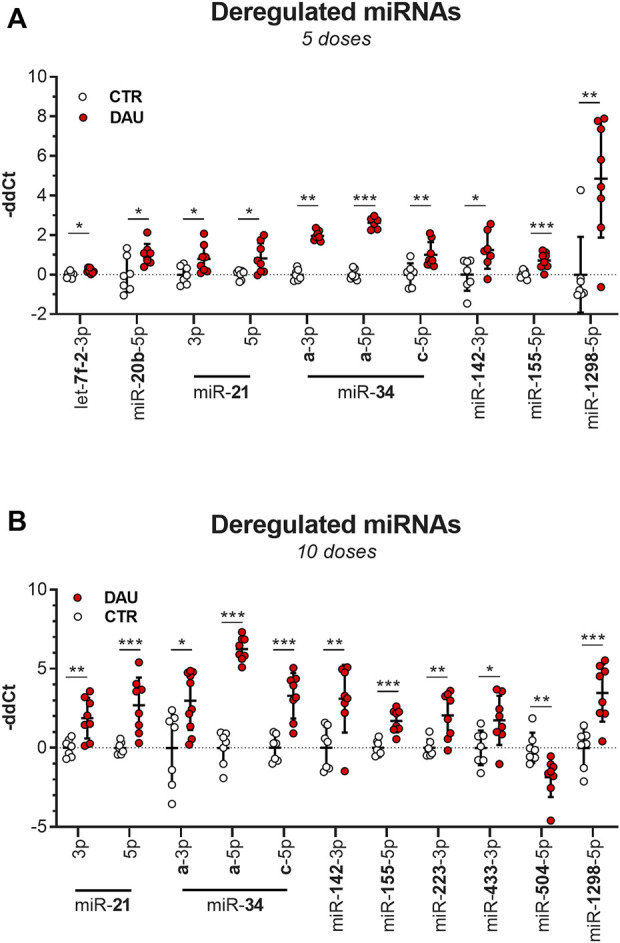
FIGURE 4.

Deregulation of miRNA expression after DAU treatment (the scatter plot showing all the individual values) (A) miRNAs which showed deregulation after 5 weeks of DAU treatment. (B) miRNAs which showed deregulation after 10 weeks of DAU treatment. Results are given as the fold change relative to the control group. Data are presented as the mean value ± SD. The statistical significance of changes as compared with the control group is displayed as follows: p < 0.05 (*); p < 0.01 (**); p < 0.001 (***).
