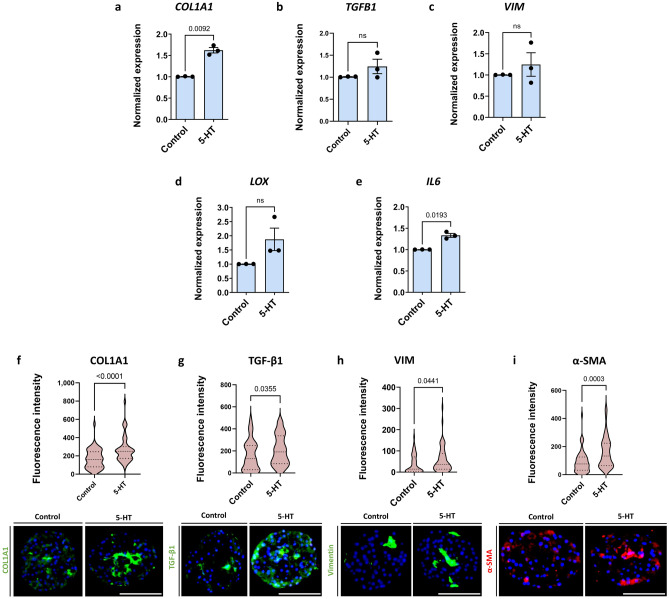
Figure 3.
5-HT treatment results in an increase of some fibrotic markers. The spheroids were treated with 10 μM 5-HT for 7 days. (a, f) COL1A1 was significantly increased at both mRNA and protein levels (n = 3). (b, g) TGF-β1 was consistently increased across experiments due to 5-HT as well. However, the increase was not significant in the case of the mRNA data. (n = 3). (c, h) Vimentin was increased following 5-HT treatment on the protein level, but not at the mRNA level. (n = 3). (d) LOX expression was repeatedly increased upon 5-HT treatment, although not significantly due to high spread (n = 3). (e) IL6 expression was significantly increased on the mRNA level (n = 3). (i) α-SMA as an important marker of liver fibrosis was significantly increased upon 5-HT treatment as well (n = 3). Blue bars represent mRNA expression data. Data is shown as mean ± SEM. Red violin plots show results of IHC analysis, where plots are created based on the fluorescence intensity (integrated density of the corresponding channel divided by the area of DAPI staining) of 10–20 sections of different spheroids per experiment. The number of experiments included in the plot is defined by n. Nuclei in the IHC images are shown in blue. The size of the spheroids is marked with a white scale bar of 100 μm. Data is shown as median with interquartile range. The width of each curve corresponds with the approximate frequency of data points in each region. All experiments were conducted with Donor 1 as the PHH donor and with two different NPC donors, either Donor 6 or Donor 7. Differences were tested using the student's t test.

