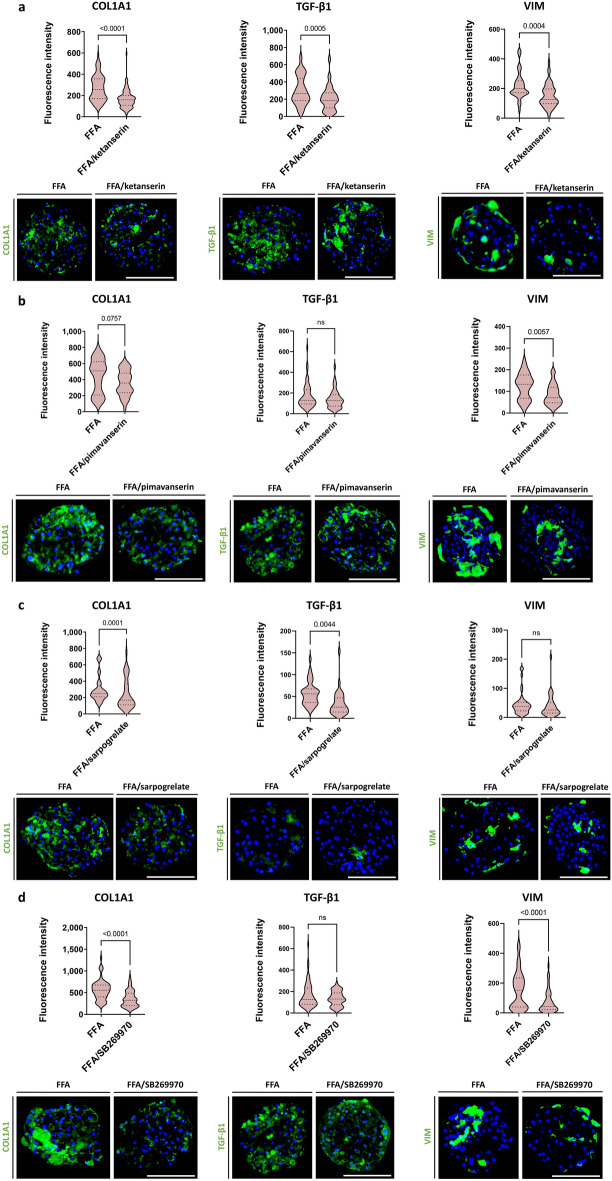
Figure 4.
5-HT receptor antagonists can reduce COL1A1 deposition. Different 5-HT receptor antagonists were screened for their anti-fibrotic potential. Ketanserin (5-HT2A and 5-HT2C antagonist), pimavanserin (inverse 5-HT2A agonist), sarpogrelate (5-HT2A and 5-HT2B antagonist), and SB-269970 (5-HT7 antagonist) were added to FFA to assess their potential in decreasing COL1A1, TGF-β1, and vimentin production. Representative images of COL1A1, TGF-β1, and vimentin stainings following a 7-day treatment with FFA with or without 5-HT receptor antagonists are presented. (a) Ketanserin significantly decreased FFA-induced COL1A1, TGF-β1, and vimentin deposition (n = 4). (b) Pimavanserin decreased COL1A1, TGF-β1, and vimentin deposition, although its effect was rather variable and thus non-significant (n = 3). (c) Sarpogrelate (n = 3) and (d) SB269970 (n = 4; 1 experiment with PHH donor 1, 1 experiment with PHH donor 2, 1 experiment with PHH donor 3, and 1 experiment with PHH donor 4; NPC from donor 6 in all 4 experiments) both significantly attenuated COL1A1 deposition. Sarpogrelate also significantly reduced TGF-β1 production, whereas SB-269970 significantly reduced vimentin. Red violin plots show results of IHC analysis, where plots are created based on the fluorescence intensity (integrated density of the corresponding channel divided by the area of DAPI staining) of 10–20 sections of different spheroids per experiment. The number of experiments included in the plot is defined by n. Nuclei in the IHC images are shown in blue. The size of the spheroids is marked with a white scale bar of 100 μm. Data is shown as median with interquartile range. The width of each curve corresponds with the approximate frequency of data points in each region. Differences were tested using the student's t test.

