Figure 5.
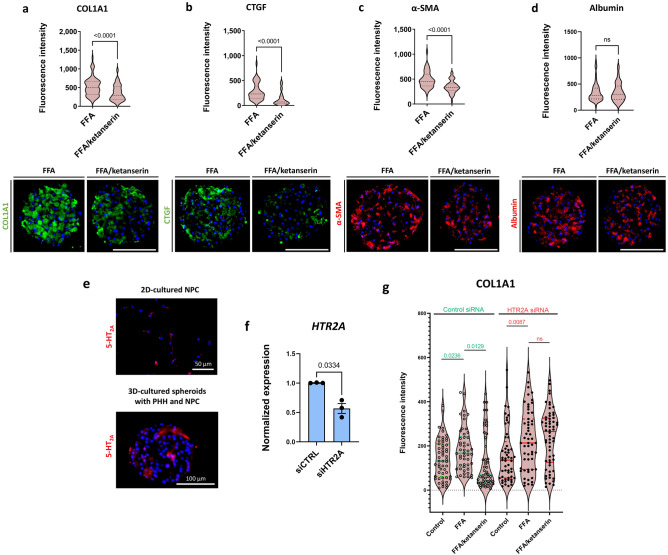
Ketanserin and 5-HT2A signalling inhibition have anti-fibrotic properties. Spheroids were treated with FFA with or without ketanserin from day 7 until day 14. (a) Ketanserin reduced the FFA-induced COL1A1 deposition in 4 different PHH donors and 2 different NPC donors (n = 4; PHH donors 1, 2, 3, and 4; NPC donor 6 and 7). (b, c) Representative images of CTGF and α-SMA show that ketanserin was capable of decreasing these two markers of liver fibrosis (n = 3; PHH donor 1; NPC donor 6 and 7). (d) Ketanserin treatment did not affect albumin deposition in the spheroids (n = 3). Violin plots show results of IHC analysis, where plots are rated based on the fluorescence intensity (integrated density of the corresponding channel divided by the area of DAPI staining) of 10–20 sections of different spheroids per experiment. The number of experiments included in the plot is defined by n. Nuclei in the IHC images are shown in blue. Size of spheroids is marked with a white scale bar of 100 μm. (e) NPC from Donor 6 were cultured in 2D for 2 days and afterwards stained for 5-HT2A. Almost all cells were positive for 5-HT2A (upper panel). Furthermore, 3D spheroids comprised of both PHH (Donor 1) and NCP (Donor 6) were stained for 5-HT2A as well. Only a certain fraction of cells was positive for the receptor (lower panel). The size of the 2D cultured cells is presented with a white scale bar of 50 μm, whereas the size of a spheroid is presented with a white scale bar of 100 μm. Nuclei in the images are shown in blue. (f) Afterwards, 5-HT2A was silenced using 5HT2A siRNA with approximately 45% of reduction in expression. (g) Ketanserin significantly reduced the FFA-induced COL1A1 in the control siRNA-treated spheroids, whereas this was not the case in the 5HT2A-silenced spheroids (n = 3). Every dot in the violin plot represents the quantified fluorescence intensity of one stained section of a spheroid. Data in the violin plots is shown as median with interquartile range. The width of each curve corresponds with the approximate frequency of data points in each region. Differences were tested using the student's t test.

