Figure 2.
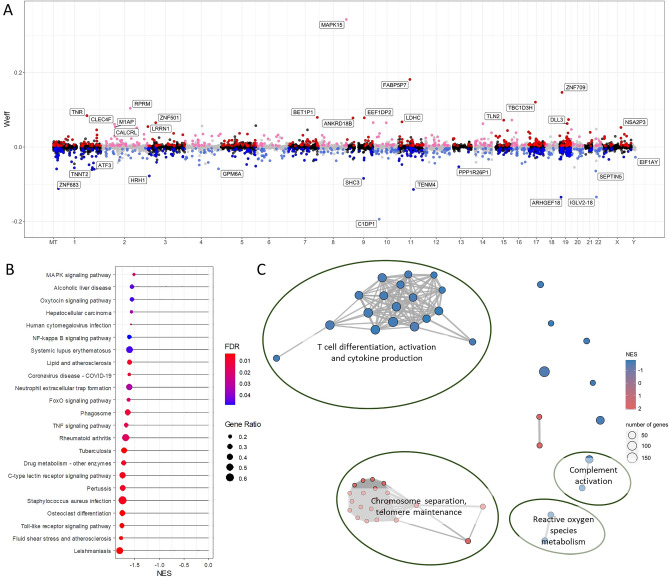
Genes and pathways correlated with vitamin D status in CD4+ T cells from healthy controls. (A) Mirror Manhattan plot of gene-vitamin D correlation analysis. Each dot represents a gene, x-axis represents gene location in the genome, y-axis represents weighted effect statistic (Weff) defined as − log10P-value * (log2 change in expression per 1 nmol/L change in 25(OH)D level). Red dots represent genes positively correlated with vitamin D level with P < 0.05, and blue dots represent genes negatively correlated and P < 0.05. (B) Gene set enrichment analysis (GSEA) using the KEGG Pathway database, shows negative enrichment of pathways involved in immune and cellular signaling pathways (FDR < 0.05). Gene ratio in GSEA is the ratio of core genes annotated in a term. (C) Enrichment map of GSEA results of Gene Ontology Biological Process terms. Each node represents an enriched gene set (FDR < 0.05), thickness of lines between node represent degree of overlap in genes between sets, and node color represents Normalized Enrichment Score (NES).

