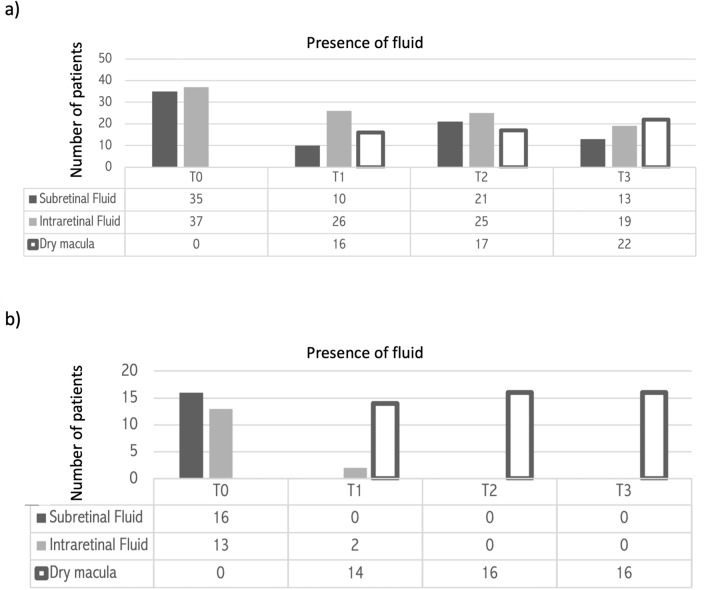
Figure 2.
Presence of subretinal fluid and intraretinal fluid in switched patients (a) and naïve patients (b) at different time points. 70 patients were analyzed, 54 in the switched group, 16 in the naïve group. Number of patients affected by any kind of fluid is shown in the y-axis, timepoints in the x-axis (T0 = baseline; T1 = after the loading phase; T2 = at week 24; T3 = at last follow-up). Dark grey columns represent subretinal fluid; light grey columns represent intraretinal fluid; white columns represent dry macula. In both study groups, the number of patients presenting any kind of fluid was statistically reduced at every timepoint compared to T0 (p < 0.05), with consequent increase in the number of patients with dry macula.

