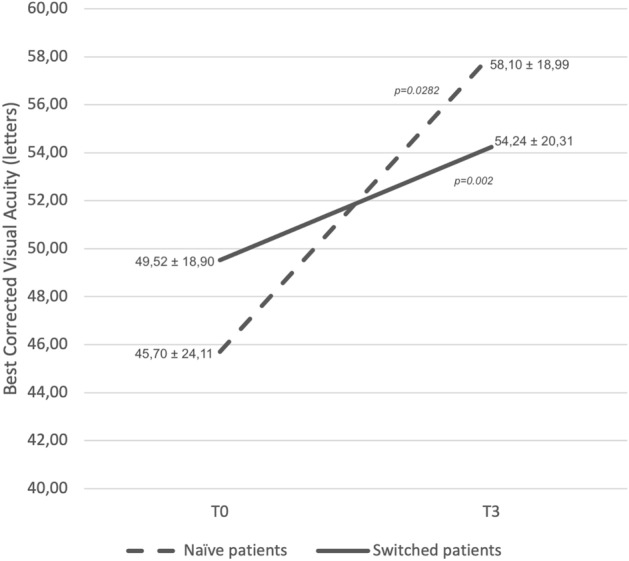
Figure 5.

Best corrected visual acuity variation in switched patients (solid line) and naïve patients (dashed line) between T0 and T3. 70 patients were analyzed, 54 in the switched group, 16 in the naïve group. Best corrected visual acuity is shown in the y-axis (values are expressed in letters), timepoints in the x-axis (T0 = baseline; T3 = at last follow-up). Mean values ± standard deviation are reported at each timepoint. Statistical significance was defined as a p-value < 0.05. Significance (p) between T0 and T3 is reported under brackets: statistical improvement was noted in both switched and naïve patients.
