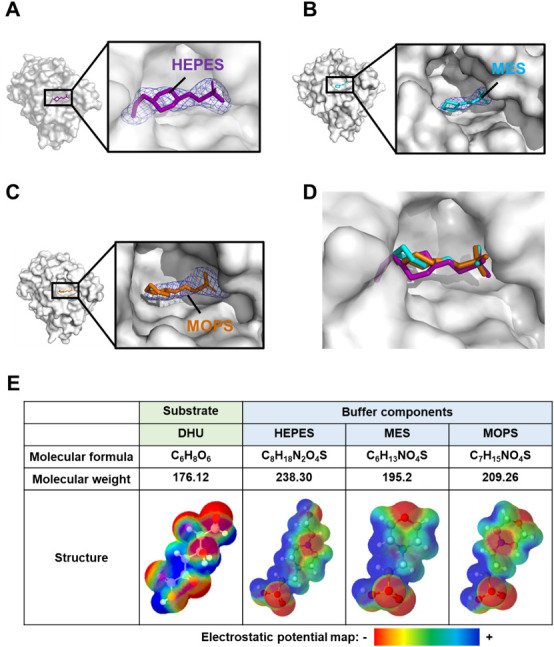
Fig. 3. Crystal structures of LrhKduI in complex with substrate analogs.

(A) Molecular surface model of HEPES-bound LrhKduI. (B) Molecular surface model of MES-bound LrhKduI. (C) Molecular surface model of MOPS-bound LrhKduI. Electron density map at 3.0 σ (Fo-Fc). (D) Superimposition of HEPES (purple), MES (cyan), and MOPS (orange) bound to LrhKduI. (E) Comparison of DHU, HEPES, MES, and MOPS.
