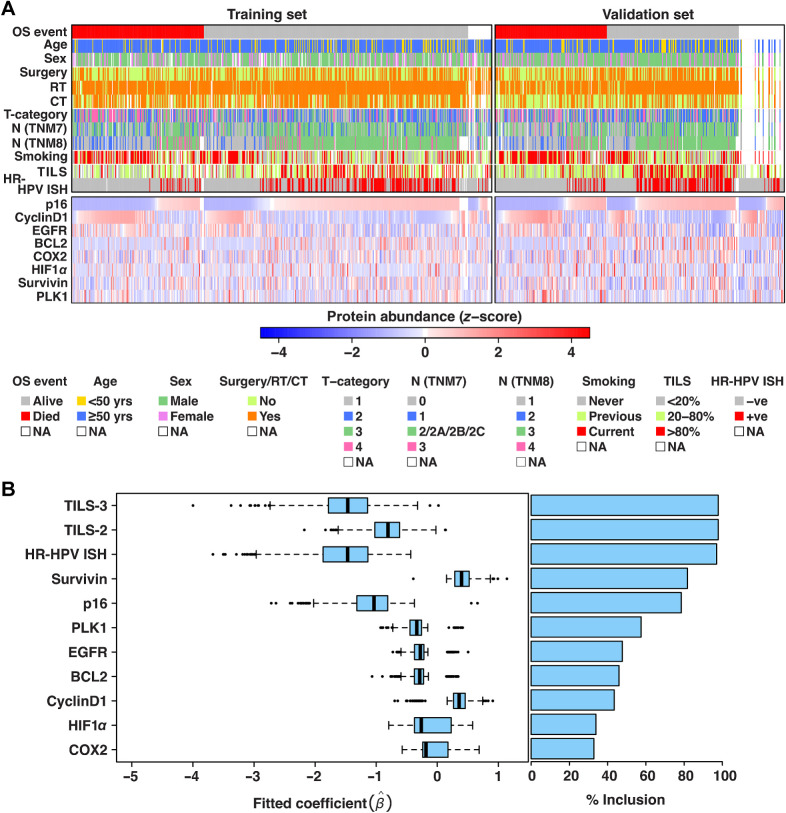
Figure 2.
A, Heatmaps summarizing the molecular and clinical data from training and validation sets. Rows contain clinical covariates and molecular biomarkers, while columns contain patients. Protein abundance H-scores (range: 0–300) were divided by 30 and Z transformed (μ = 0, σ = 1) for training and validation sets separately. Column order in each of the training and validation sets was determined by first sorting (low to high Z-score) on the protein biomarkers one by one (bottom up) and then OS event. B, Box plots displaying range of fitted coefficients including 25th percentile (Q1), median, and 75th percentile (Q3). To test the stability of the variables selected in the multivariable model, bootstrapping was performed on the training cohort (1,000 times) and Cox proportional hazards model was fitted with backward elimination on each subset. For each bootstrap iteration, coefficients of the resulting variables selected by the model are displayed in the box plots alongside their % frequency of inclusion over 1,000 iterations. Bootstrapping results confirmed the relative importance of variables in our original model (Supplementary Table S6), as these were ranked among the top recurrently selected variables over 1,000 iterations. Upper whisker of the box plots indicates: min (max(x), Q3 + 1.5 × IQR) and lower whisker indicates: max (min(x), Q1–1.5 × IQR) where IQR = Q3−Q1. Color key: TILS-3 = high, TILS-2 = moderate, TILS-1 = low.

