. 2023 Oct 23;30(2):356–367. doi: 10.1158/1078-0432.CCR-23-1013

Figure 3.

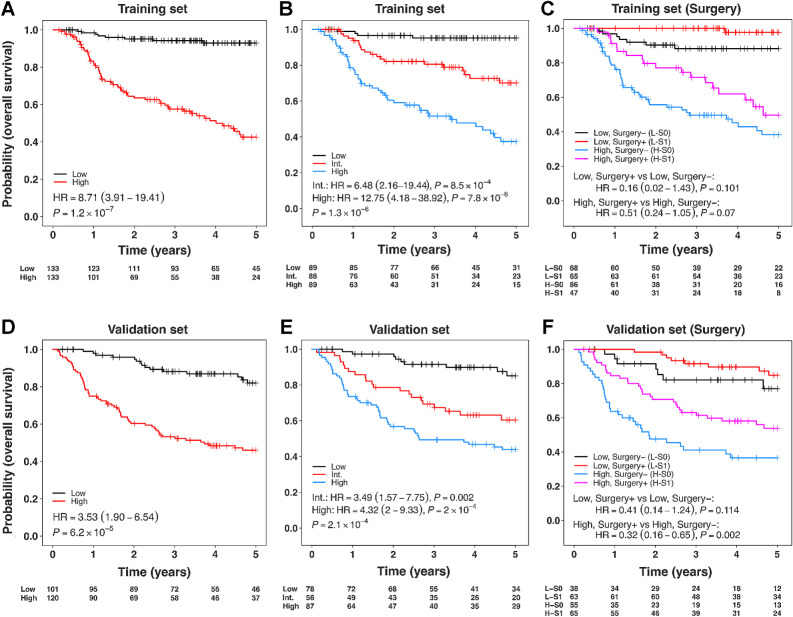
Figure 3. A–C, Prognostic and predictive assessment of risk groups predicted by multivariable survival model (trained with backward elimination using AIC) based on molecular biomarkers only with OS, when applied to the training cohort. D–F, Prognostic and predictive assessment of risk groups predicted by the molecular biomarkers only multivariable model, when applied to the validation cohort. Risk groups in the validation cohort were created using the thresholds (two-group classification: median risk score; three-group classification: tertiles of risk score) derived from the training set. Color key A, D: black = low-risk group, red = high-risk group; B, E: black = low-risk, red = intermediate (Int.)-risk, Blue=high-risk group; C, F: Red = low-risk surgery, black = low-risk no surgery, pink = high-risk surgery, blue = high-risk no surgery group. Models were adjusted for clinical covariates: T-category, N-category, smoking status, age, radiotherapy, and chemotherapy.

A–C, Prognostic and predictive assessment of risk groups predicted by multivariable survival model (trained with backward elimination using AIC) based on molecular biomarkers only with OS, when applied to the training cohort. D–F, Prognostic and predictive assessment of risk groups predicted by the molecular biomarkers only multivariable model, when applied to the validation cohort. Risk groups in the validation cohort were created using the thresholds (two-group classification: median risk score; three-group classification: tertiles of risk score) derived from the training set. Color key A, D: black = low-risk group, red = high-risk group; B, E: black = low-risk, red = intermediate (Int.)-risk, Blue=high-risk group; C, F: Red = low-risk surgery, black = low-risk no surgery, pink = high-risk surgery, blue = high-risk no surgery group. Models were adjusted for clinical covariates: T-category, N-category, smoking status, age, radiotherapy, and chemotherapy.