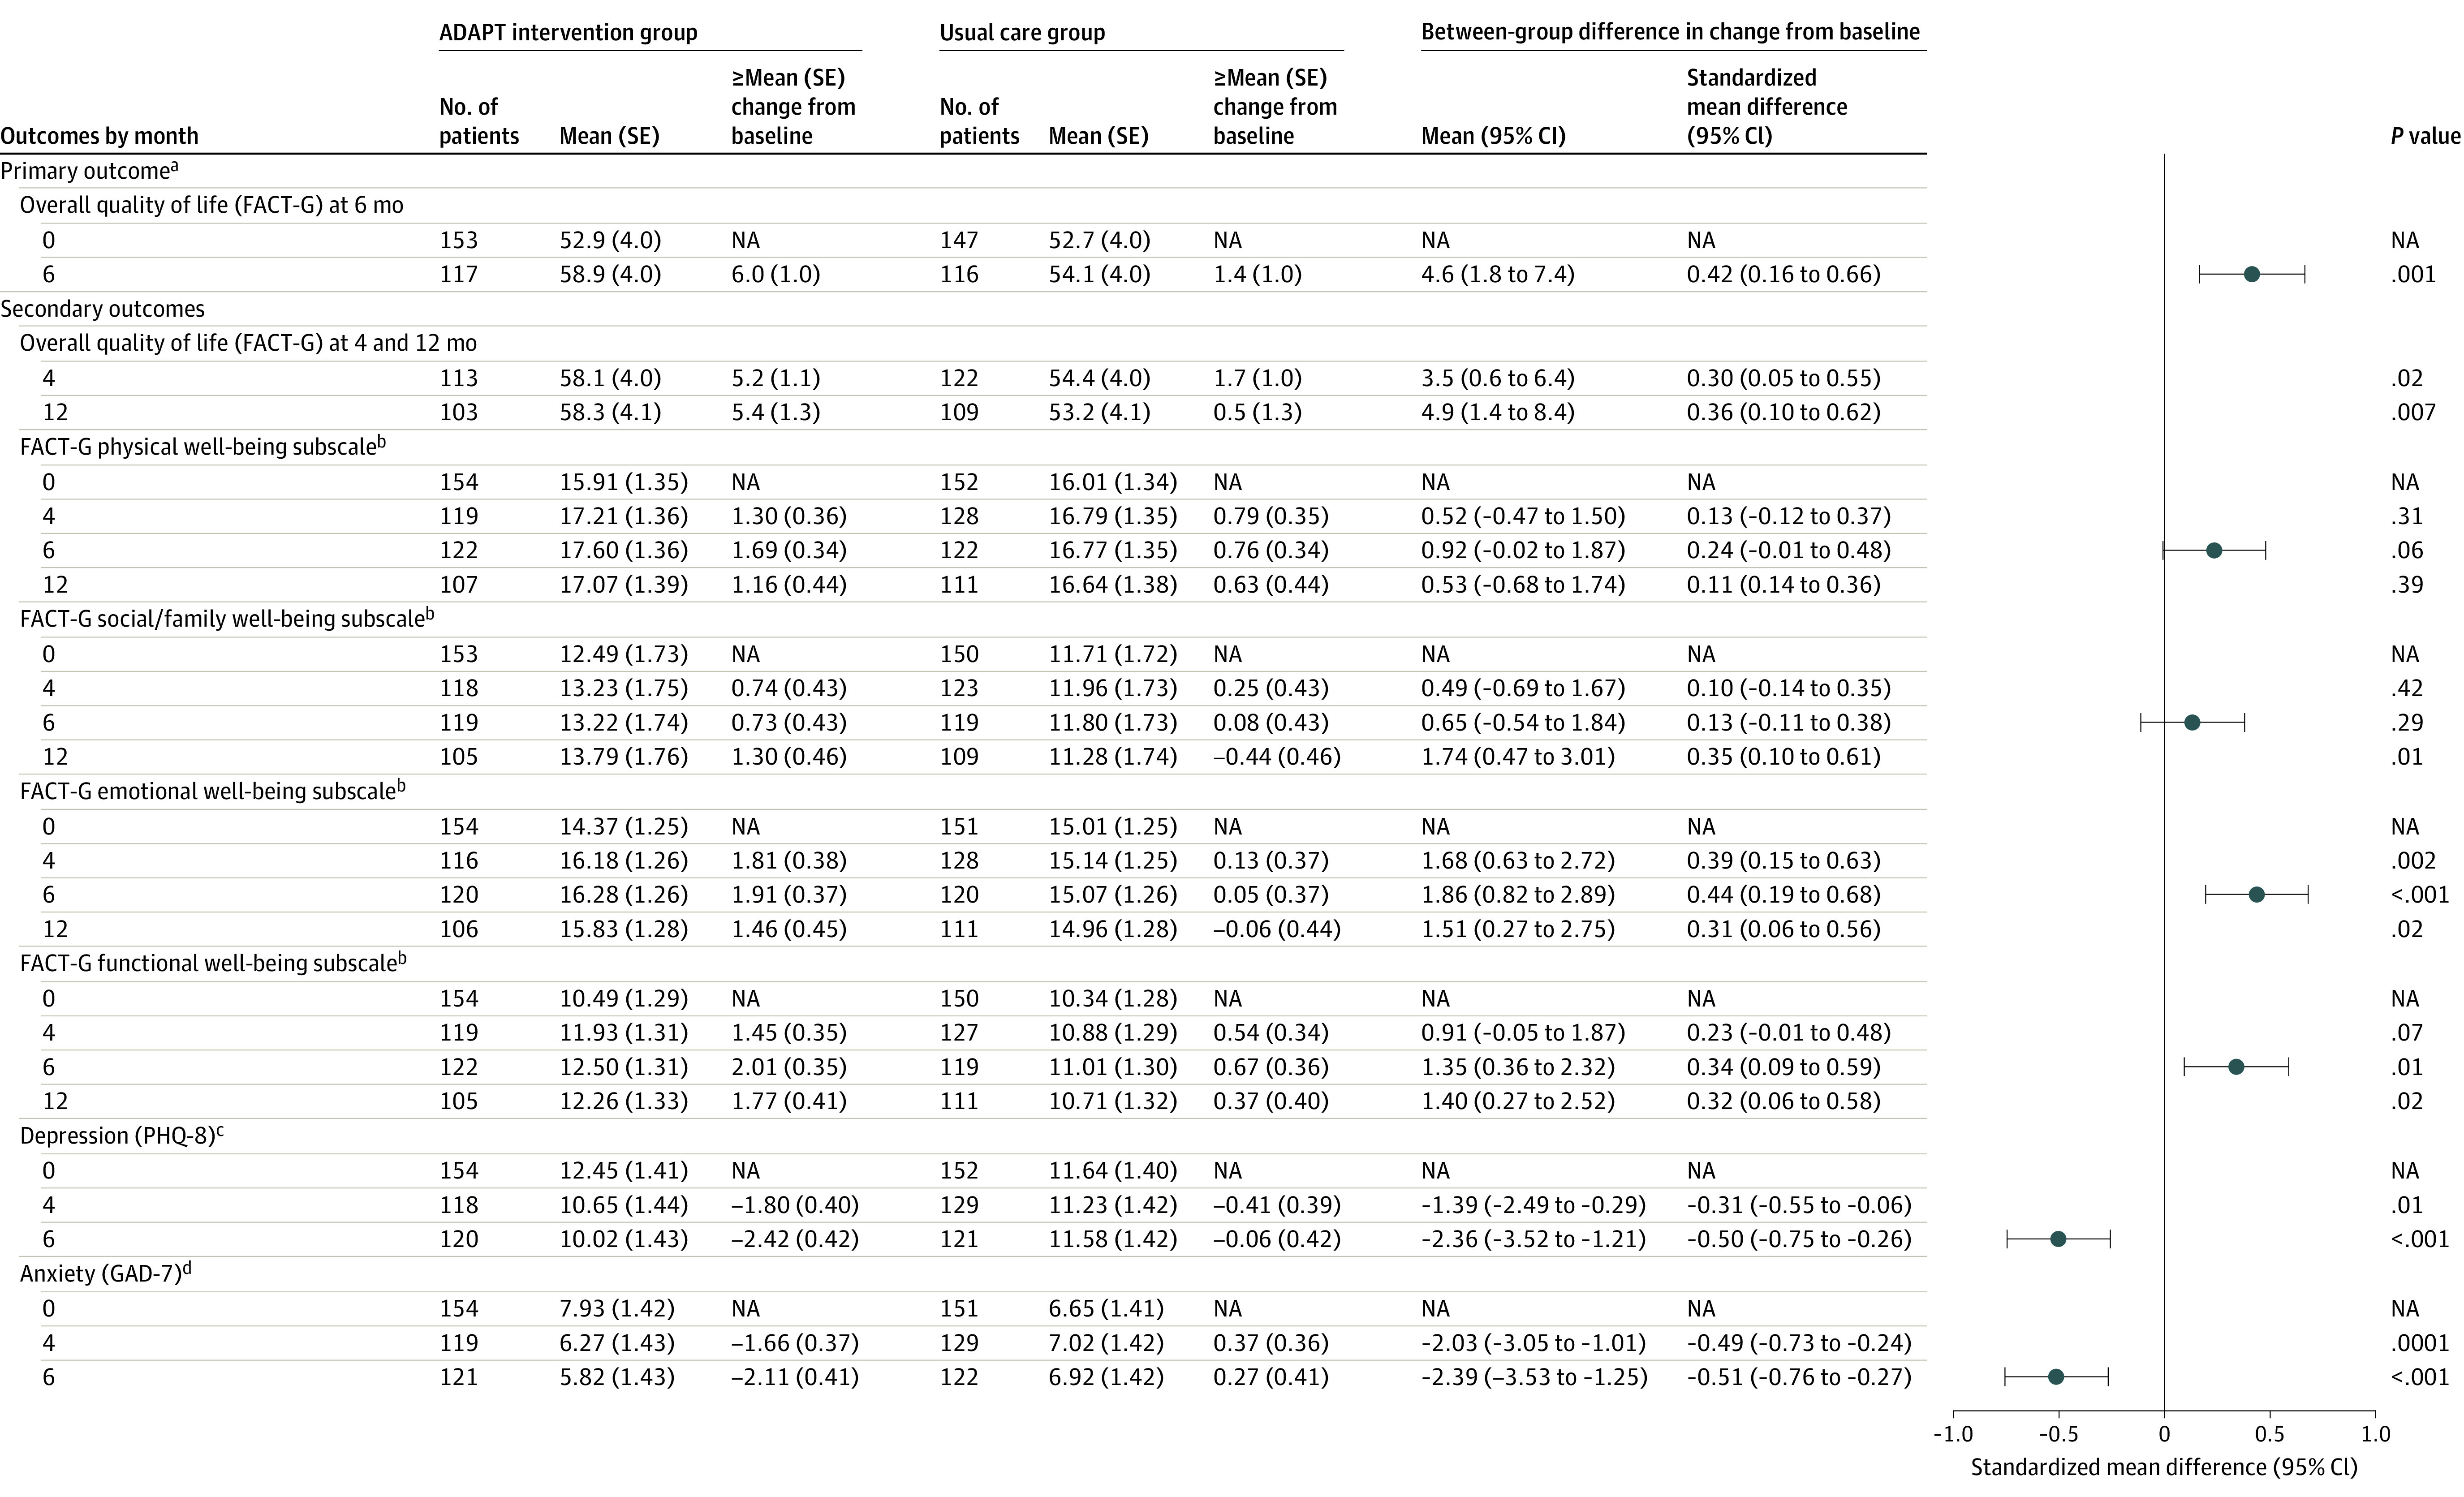
Figure 2. Regression-Estimated Means and Change Scores for Quality-of-Life Outcomes.

Values were obtained from linear mixed models (interaction between treatment status and dummy variables for time) and adjusted for disease status at randomization. All outcome measures are patient-reported. aSee Outcomes section for explanation of the FACT-G. bFor physical and for social/family well-being, the score range is 0 to 28; for emotional and for functional well-being, the score range is 0 to 24. Higher scores indicate better well-being; minimal clinically important difference [MCID], 2-3. cScore range, 0 to 24 (higher scores indicate more depressive symptoms; MCID, 3). Negative mean difference scores indicate improvement in symptoms.dScore range, 0 to 21 (higher scores indicate more anxiety symptoms; MCID, 2-4). Negative mean difference scores indicate improvement in symptoms.
