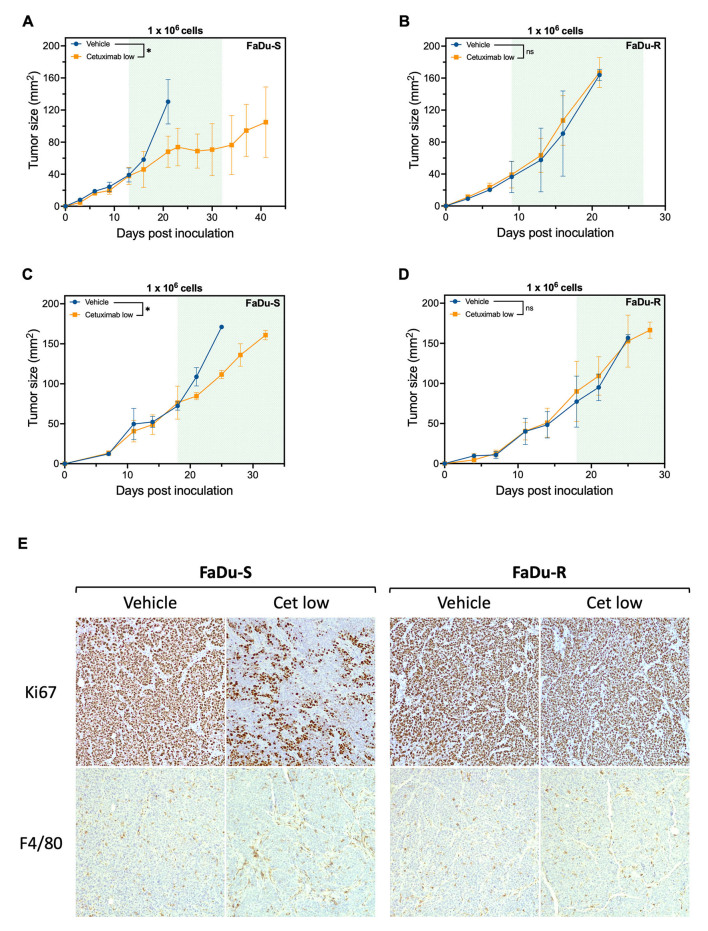
Figure 7.
Cetuximab resistance status of isogenic FaDu cell lines is maintained in CB17 Scid mice. (A-D) Tumor kinetics of CB17 Scid mice inoculated with 1 × 10⁶ cetuximab sensitive FaDu-S cells (A and C) or cetuximab resistant FaDu-R cells (B and D) following treatment with vehicle (PBS, n = 2) or cetuximab low (2.5 mg/kg, n = 3). The green area in each graph represents the treatment period [starting from (A) day 13, (B) day 9 or (C and D) day 18]. Data represent mean ± SD. P-values were determined using a linear mixed model; (E) Representative images of immunohistochemical staining for Ki67 (proliferation) and F4/80 (macrophages), shown at 100x. *P < 0.05. ns: Non-significant; PBS: phosphate-buffered saline; -R: cetuximab-resistant HNSCC cell line; -S: cetuximab-sensitive HNSCC cell line.

