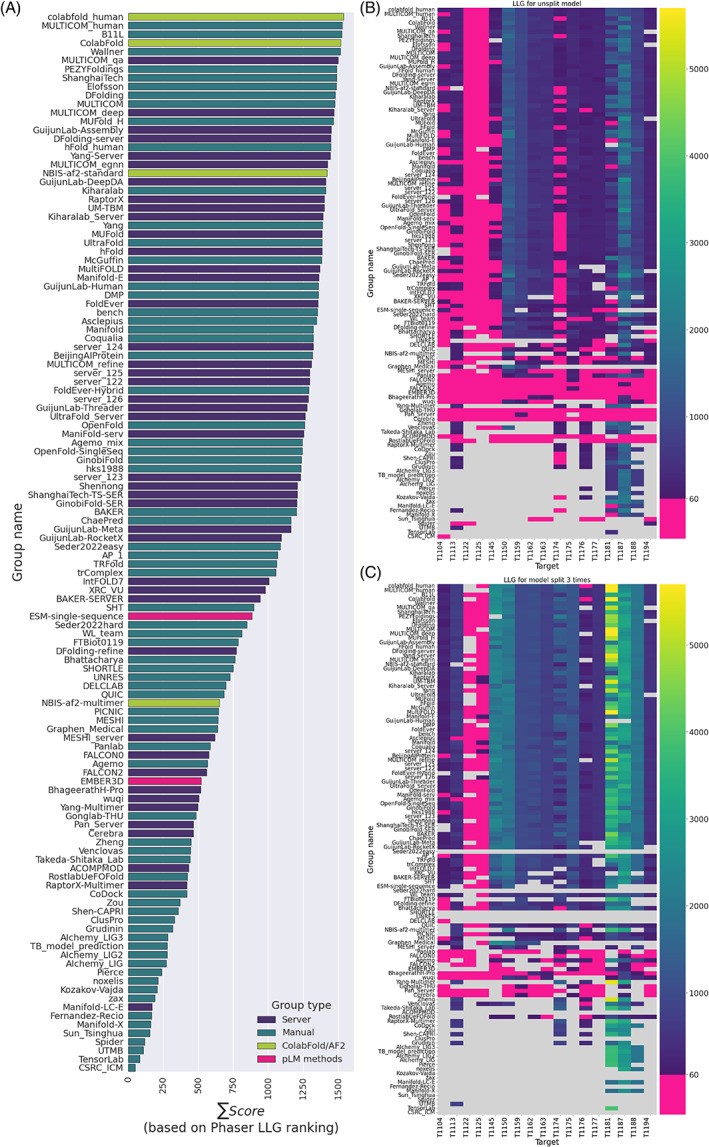
FIGURE 9.

(A) Groups ranked by the cumulative LLG‐derived ranking score described in Materials and Methods. (B,C) A comparison between the LLG scores for an ideally placed model (B) before splitting and (C) after splitting three times using the Birch algorithm in Slice'N'Dice. Pink indicates LLG scores below 60, the success threshold in MR. The blue to yellow gradient (see the coloring map next to the graph) depicts the LLG scores greater than 60 with yellow indicating the largest LLG values. Gray denotes instances where groups did not submit models for a target or where Phaser failed to produce a solution. Groups are ordered the same in all three panels.
