
Figure 3: Change in imaging parameters and liver enzymes from baseline to week 48.
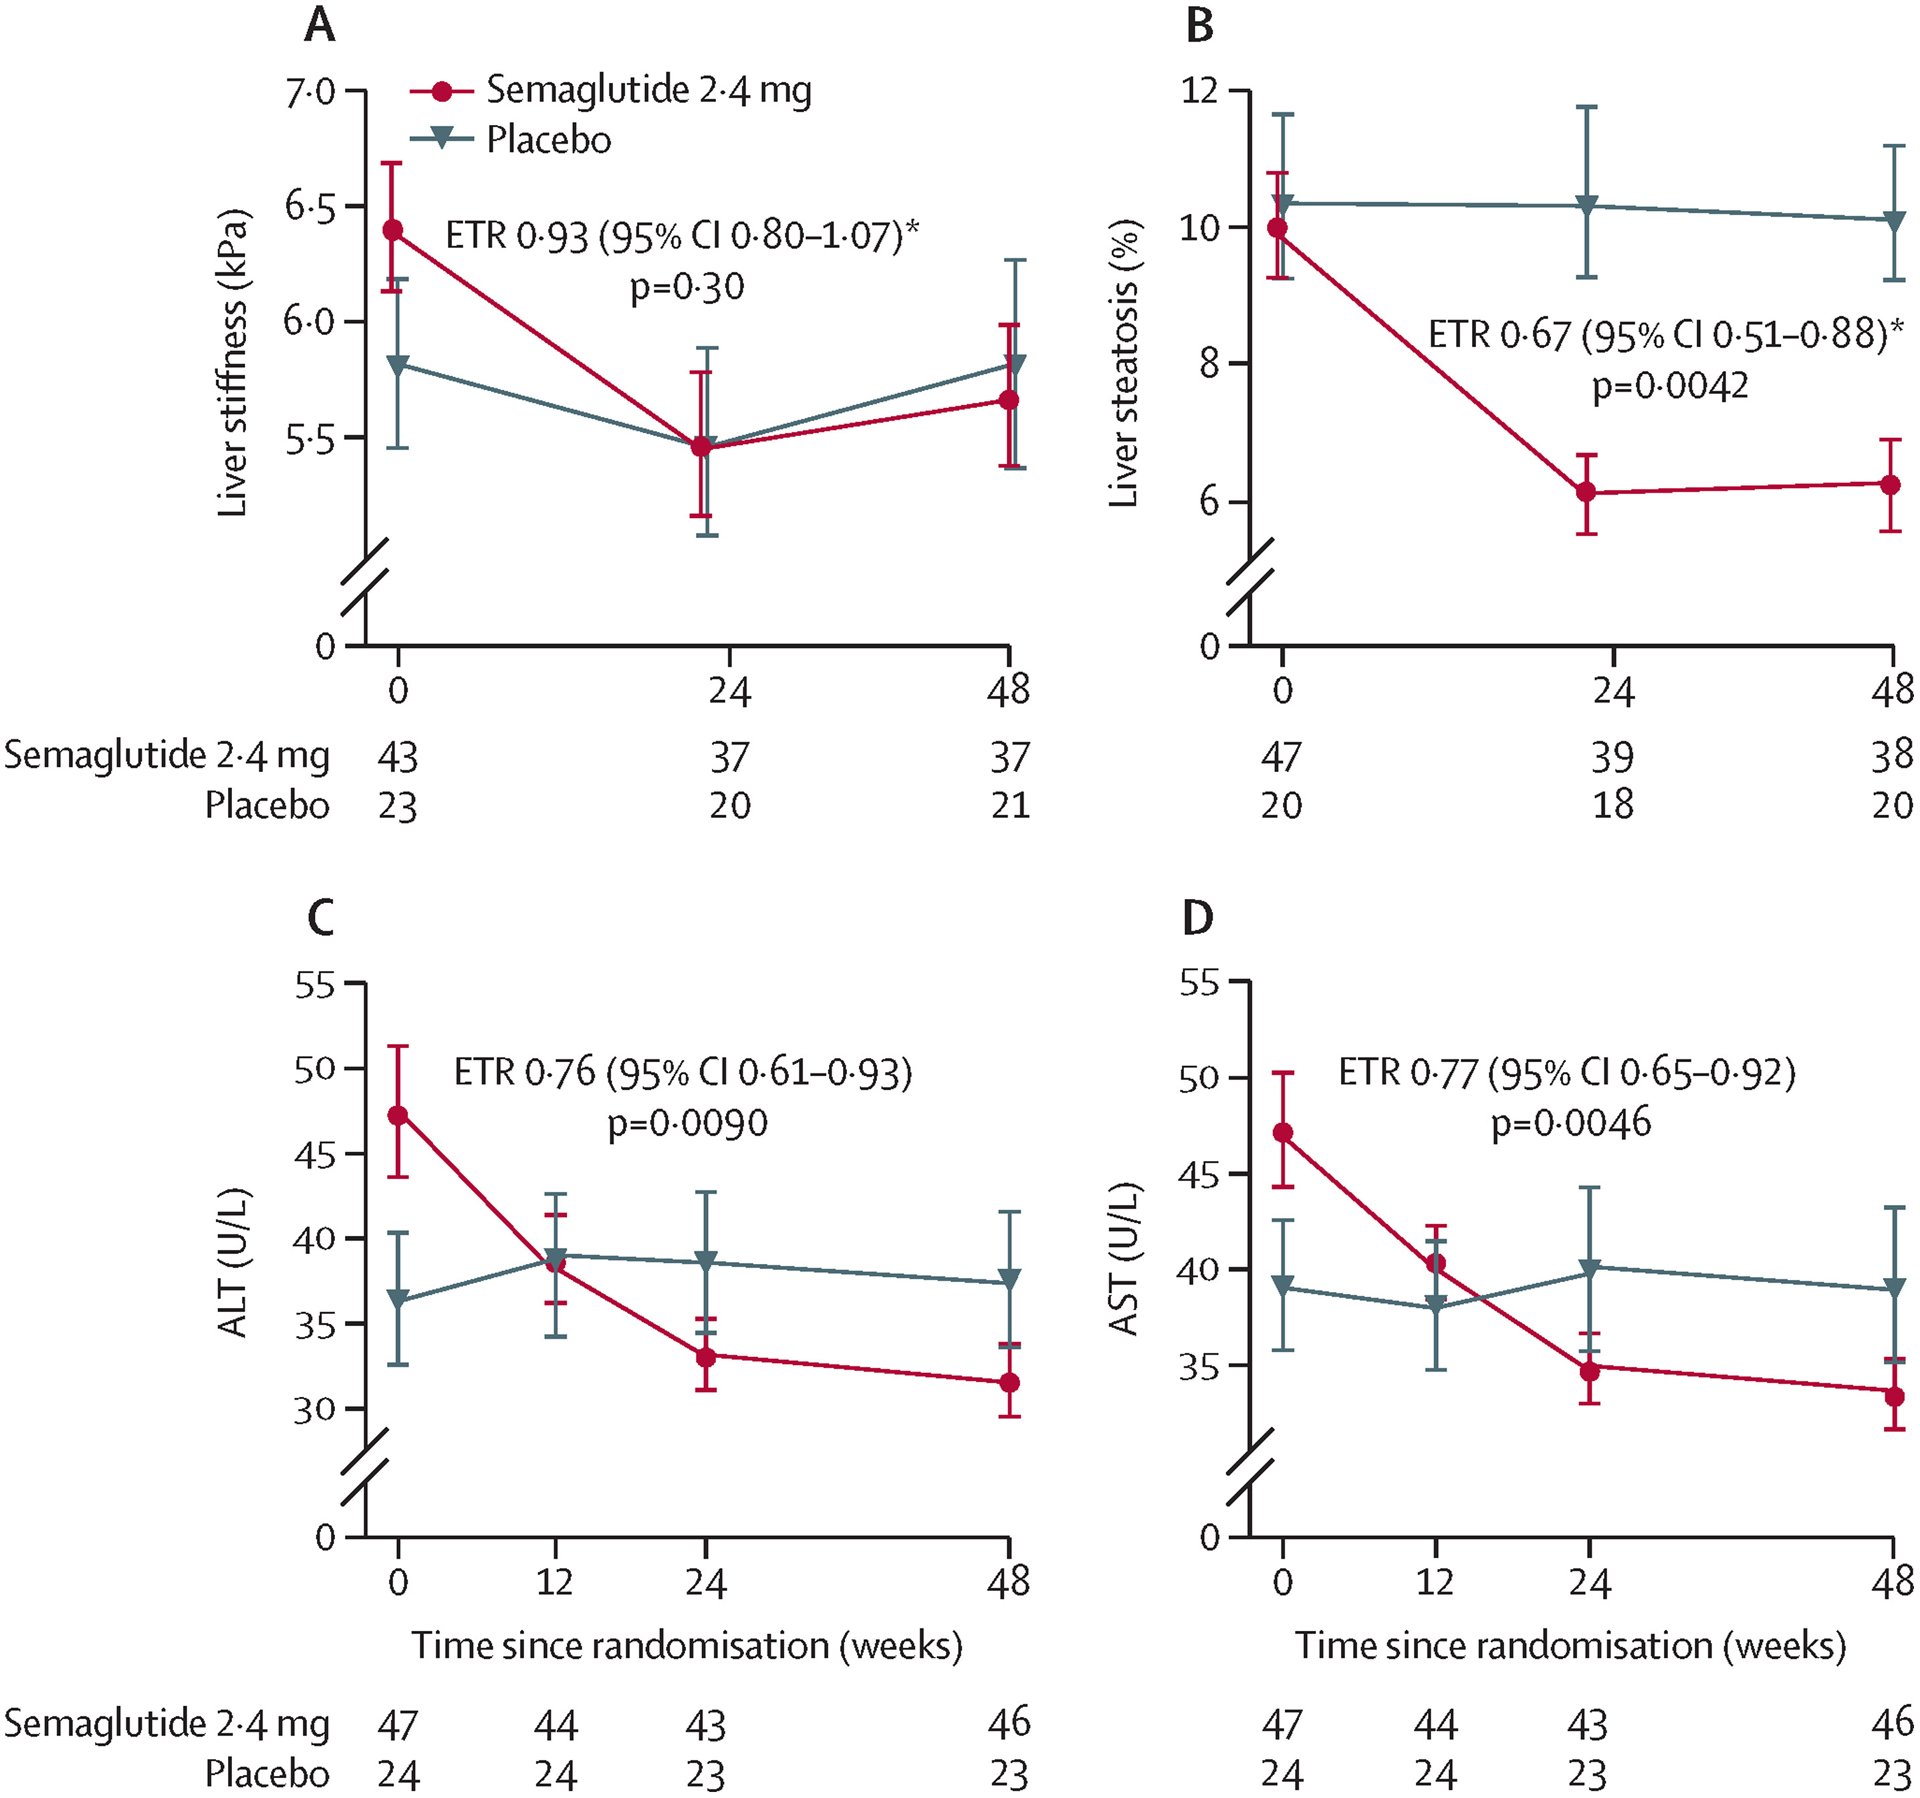
Liver stiffness assessed by MRE (A), liver steatosis assessed by MRI-PDFF (B), ALT (C), and AST (D). Number of observations per treatment group and visit is presented in the lower part of each plot. Error bars show the SE of the mean for observed values. ALT=alanine aminotransferase. ANCOVA=analysis of covariance. AST=aspartate aminotransferase. ETR=estimated treatment ratio. MRE=magnetic resonance elastography. MRI-PDFF=MRI proton density fat fraction. *ETRs with 95% CI and two-sided p-values were calculated using the same ANCOVA analysis. Missing data were imputed from the observed data in the placebo group using the same ANCOVA model but without treatment as factor.