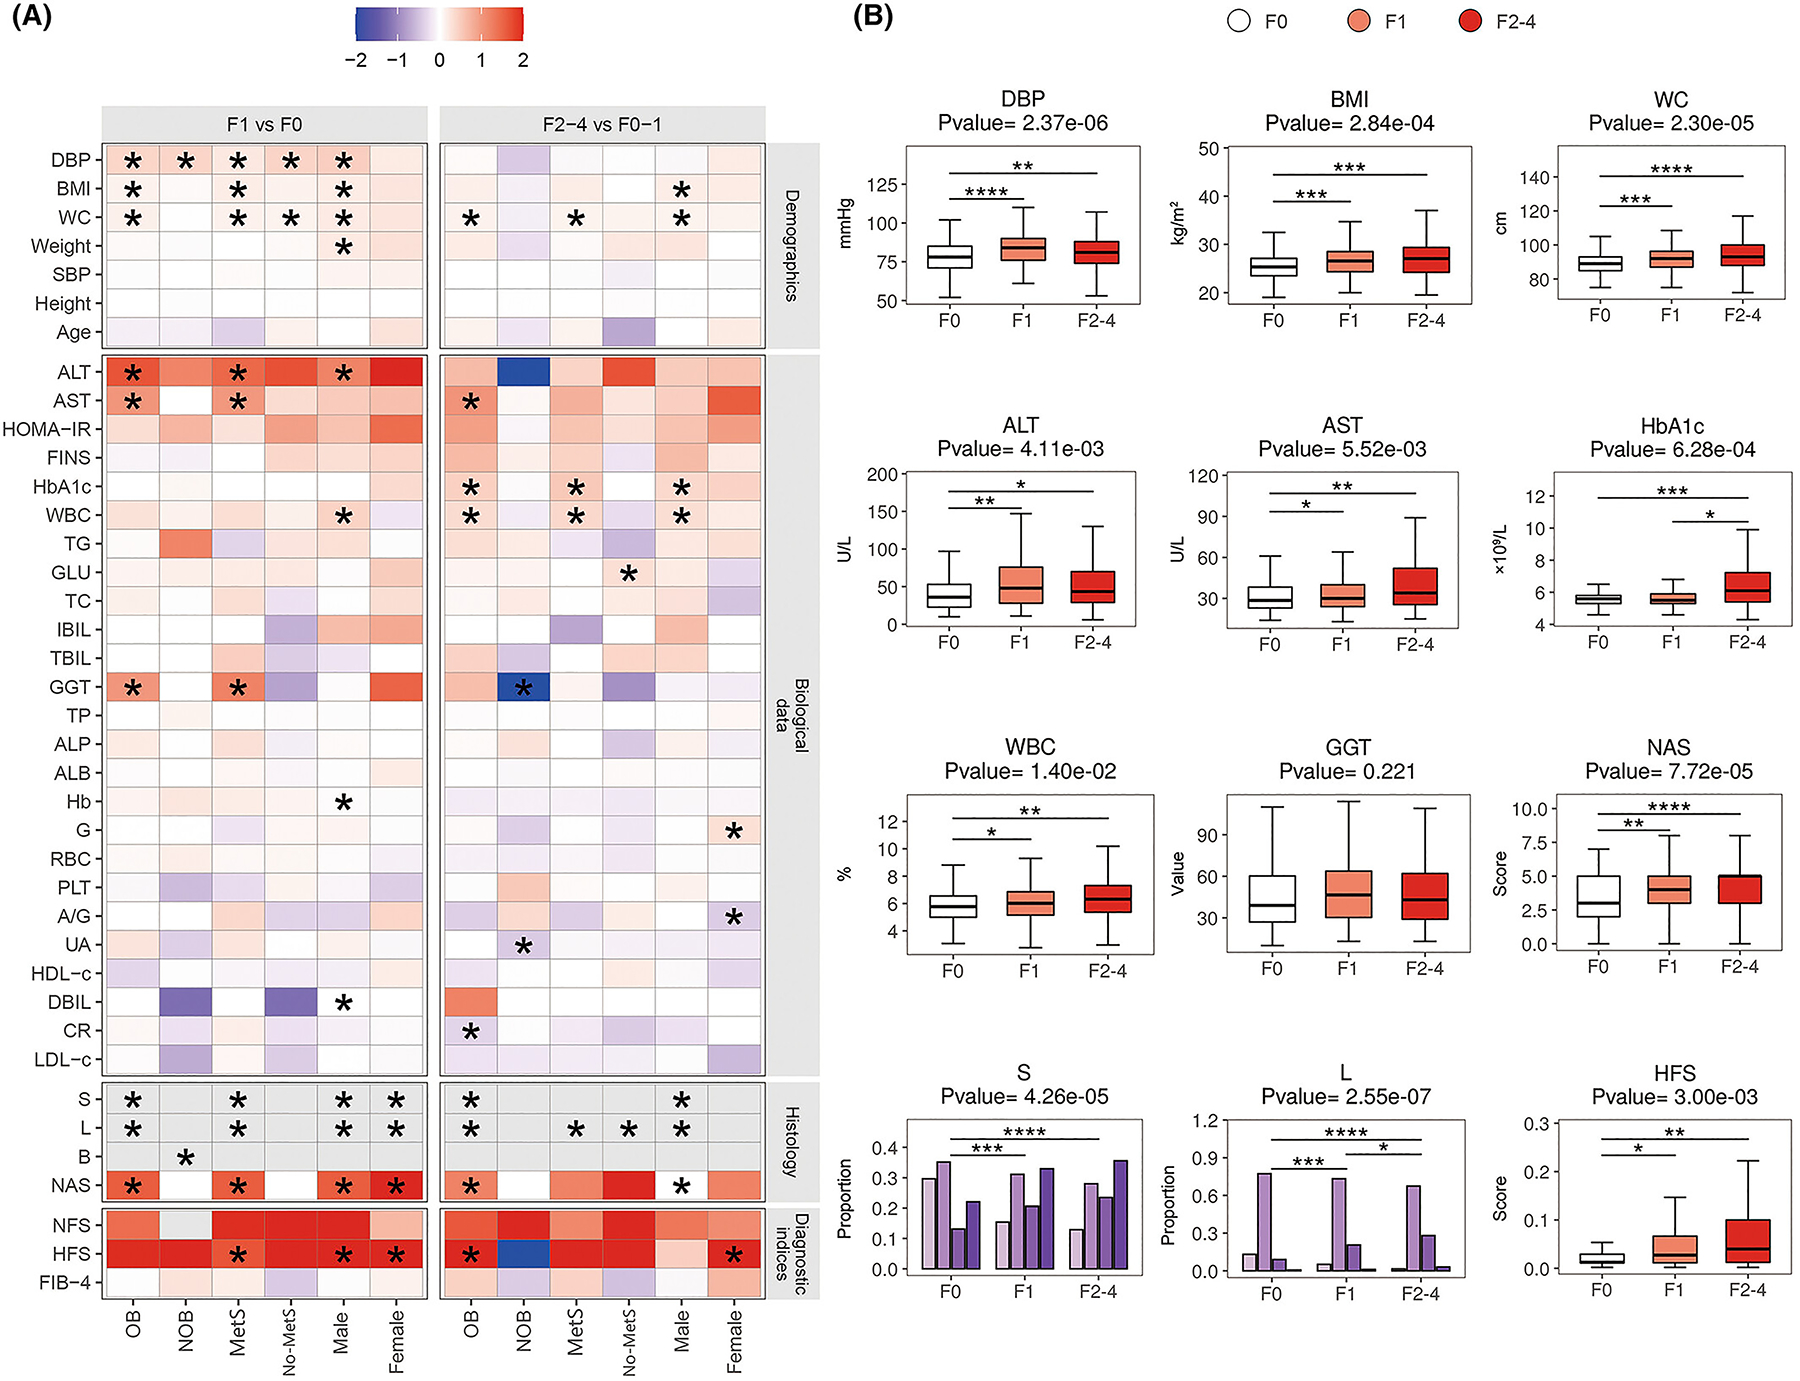
FIGURE 2.

Comparison of clinical parameters in six subgroups of NAFLD patients in the training cohort. (A) The heatmap of fold changes of demographic, biological, and histological variables and non-invasive diagnostic indices between F1 and F0, and between F2–4 and F0–1 in the six patient subgroups of the training cohort. p values were tested by parametric or non-parametric tests (as appropriate). (B) The changes of potential clinical risk factors among NAFLD patients with F0, F1, and F2–4 stages. p < 0.05 is demonstrated as an asterisk (*), p < 0.01 is demonstrated as two asterisks (**), p < 0.001 is demonstrated as three asterisks (***), and p < 0.0001 is demonstrated as four asterisks (****).
