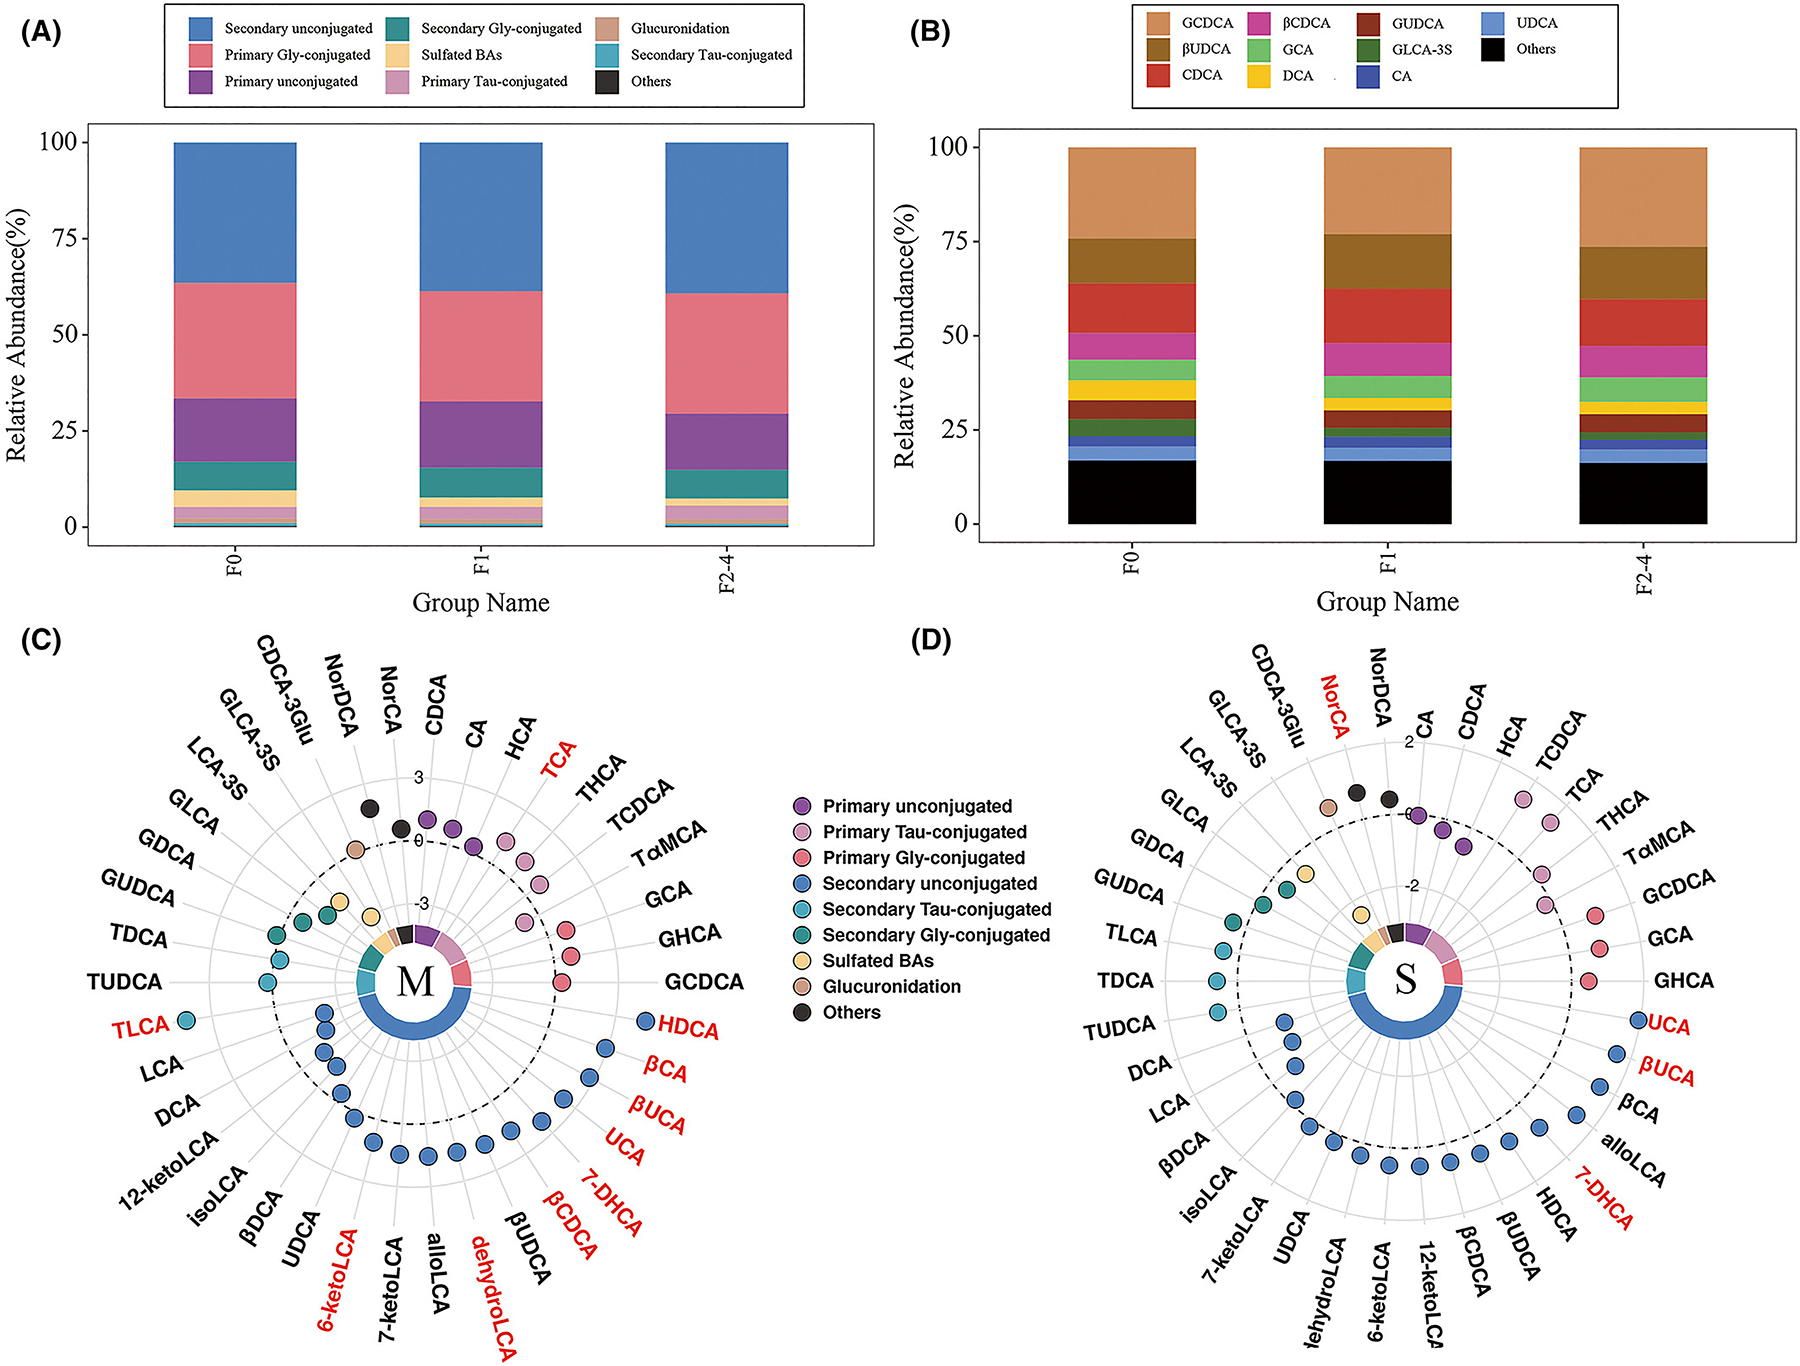
FIGURE 3.

Overall bile acid profiles of patients with NAFLD. (A) The bar plot of relative abundances of different groups of bile acids from F0, F1 to F2–4 stages. (B) The bar plot of relative abundances of top-ten abundant bile acids from F0, F1 to F2–4 stages. (C, D) The circus plot of differential bile acids (fold changes) by comparing F1 vs. F0, and F2–4 vs. F0–1, respectively. The reference circle value is defined as a fold-change value of 1.
