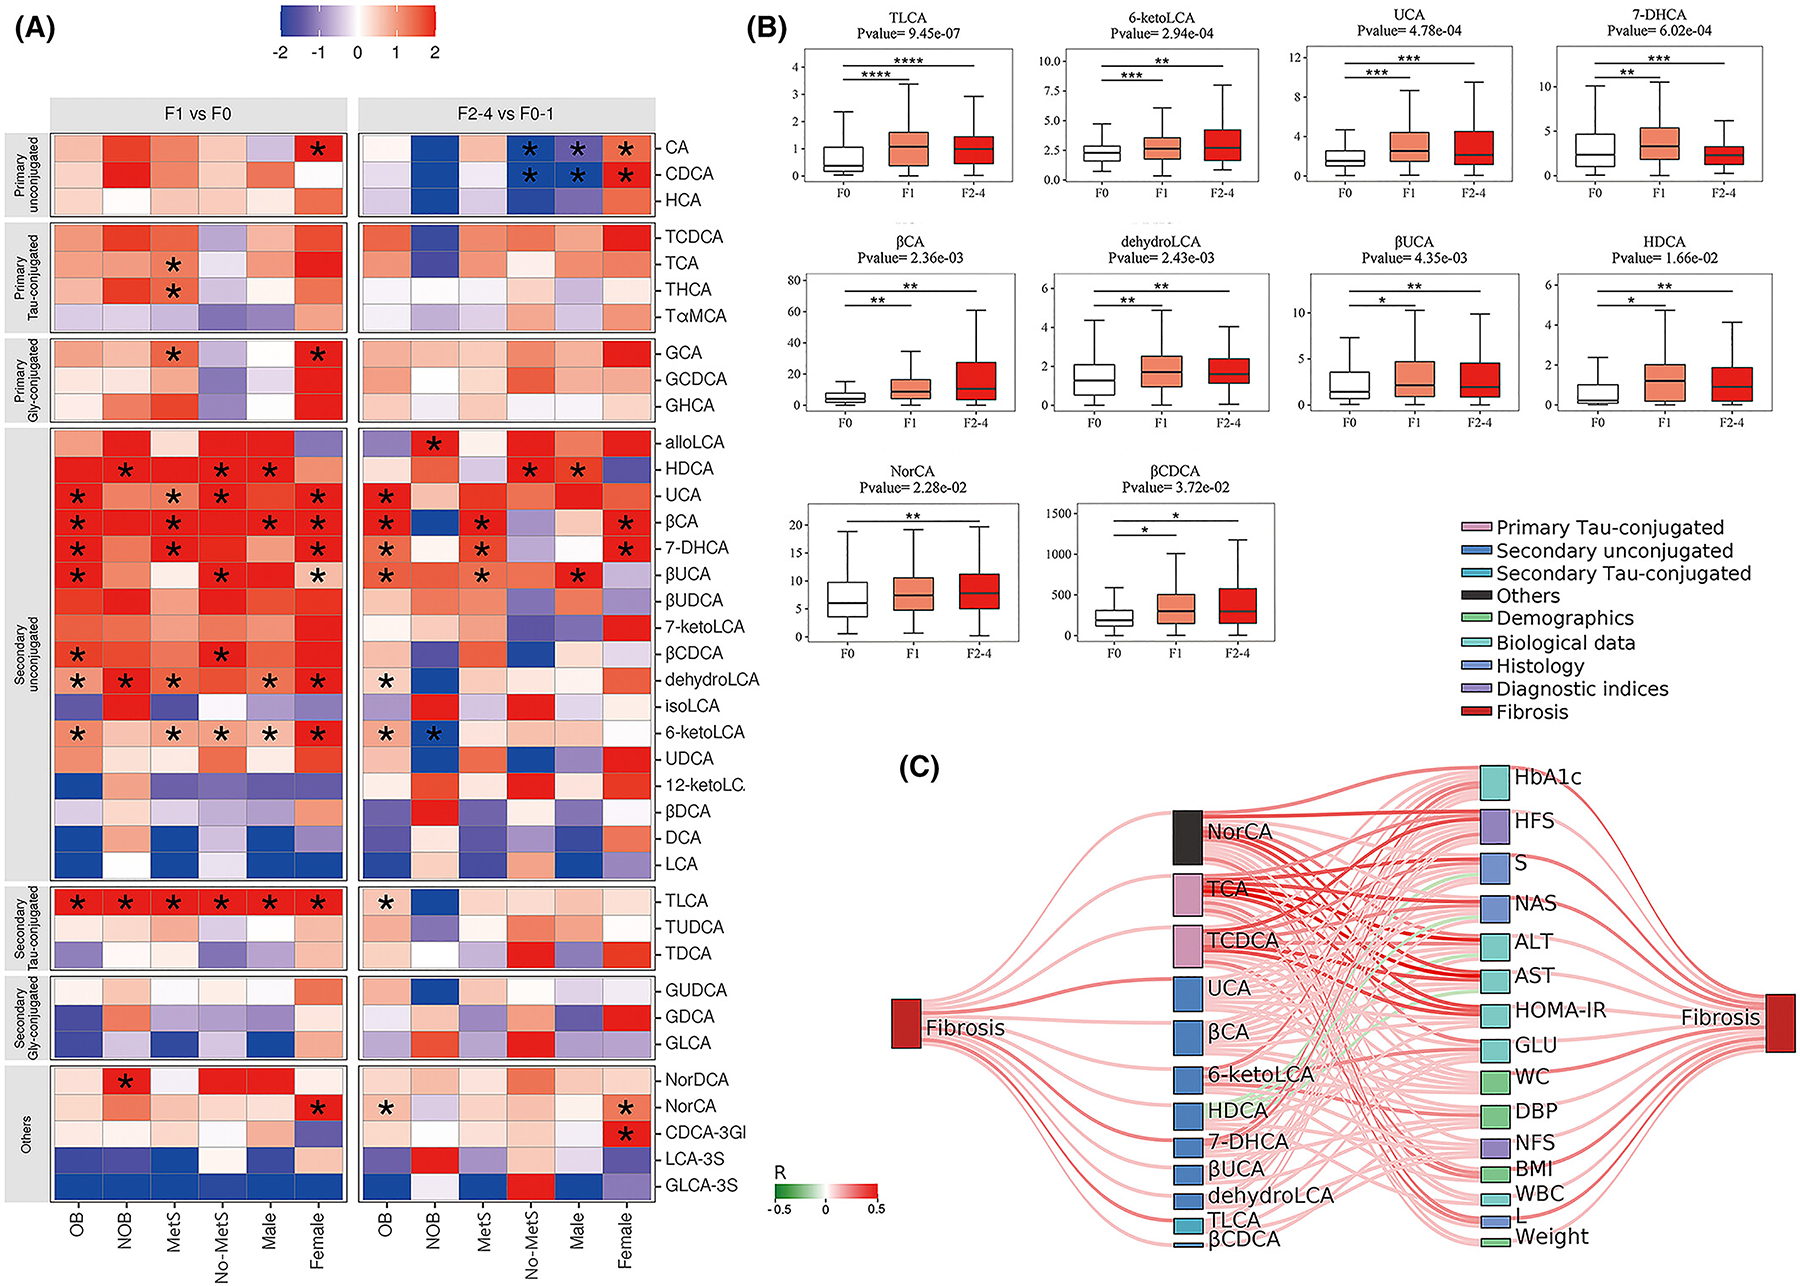
FIGURE 4.

The bile acid changes with the development of fibrosis in six subgroups of NAFLD patients in the training cohort. (A) The heatmap of fold changes of bile acids between F1 and F0, and F2–4 and F0–1 in the six patient subgroups of training cohort. p values were determined by non-parametric tests (as appropriate). (B) The bar plots of differential bile acid biomarkers among patients with F0, F1, and F2–4 fibrosis. p < 0.05 is demonstrated as an asterisk (*), p < 0.01 is demonstrated as two asterisks (**), p < 0.001 is demonstrated as three asterisks (***), and p < 0.0001 is demonstrated as four asterisks (****). (C) The Sankey network of correlations among bile acids, clinical parameters and fibrosis in patients with NAFLD. Bile acids, clinical parameters and liver fibrosis stage are shown as different colours of dots. The connecting lines between dots represent the correlation, with red lines referring to positive correlation, and green lines referring to negative correlation. Also, the width of connecting lines is depending on the correlation coefficients. p values and correlation coefficients were assessed by Spearman’s analysis. Only Spearman’s correlation analyses with a p < 0.05 were depicted.
