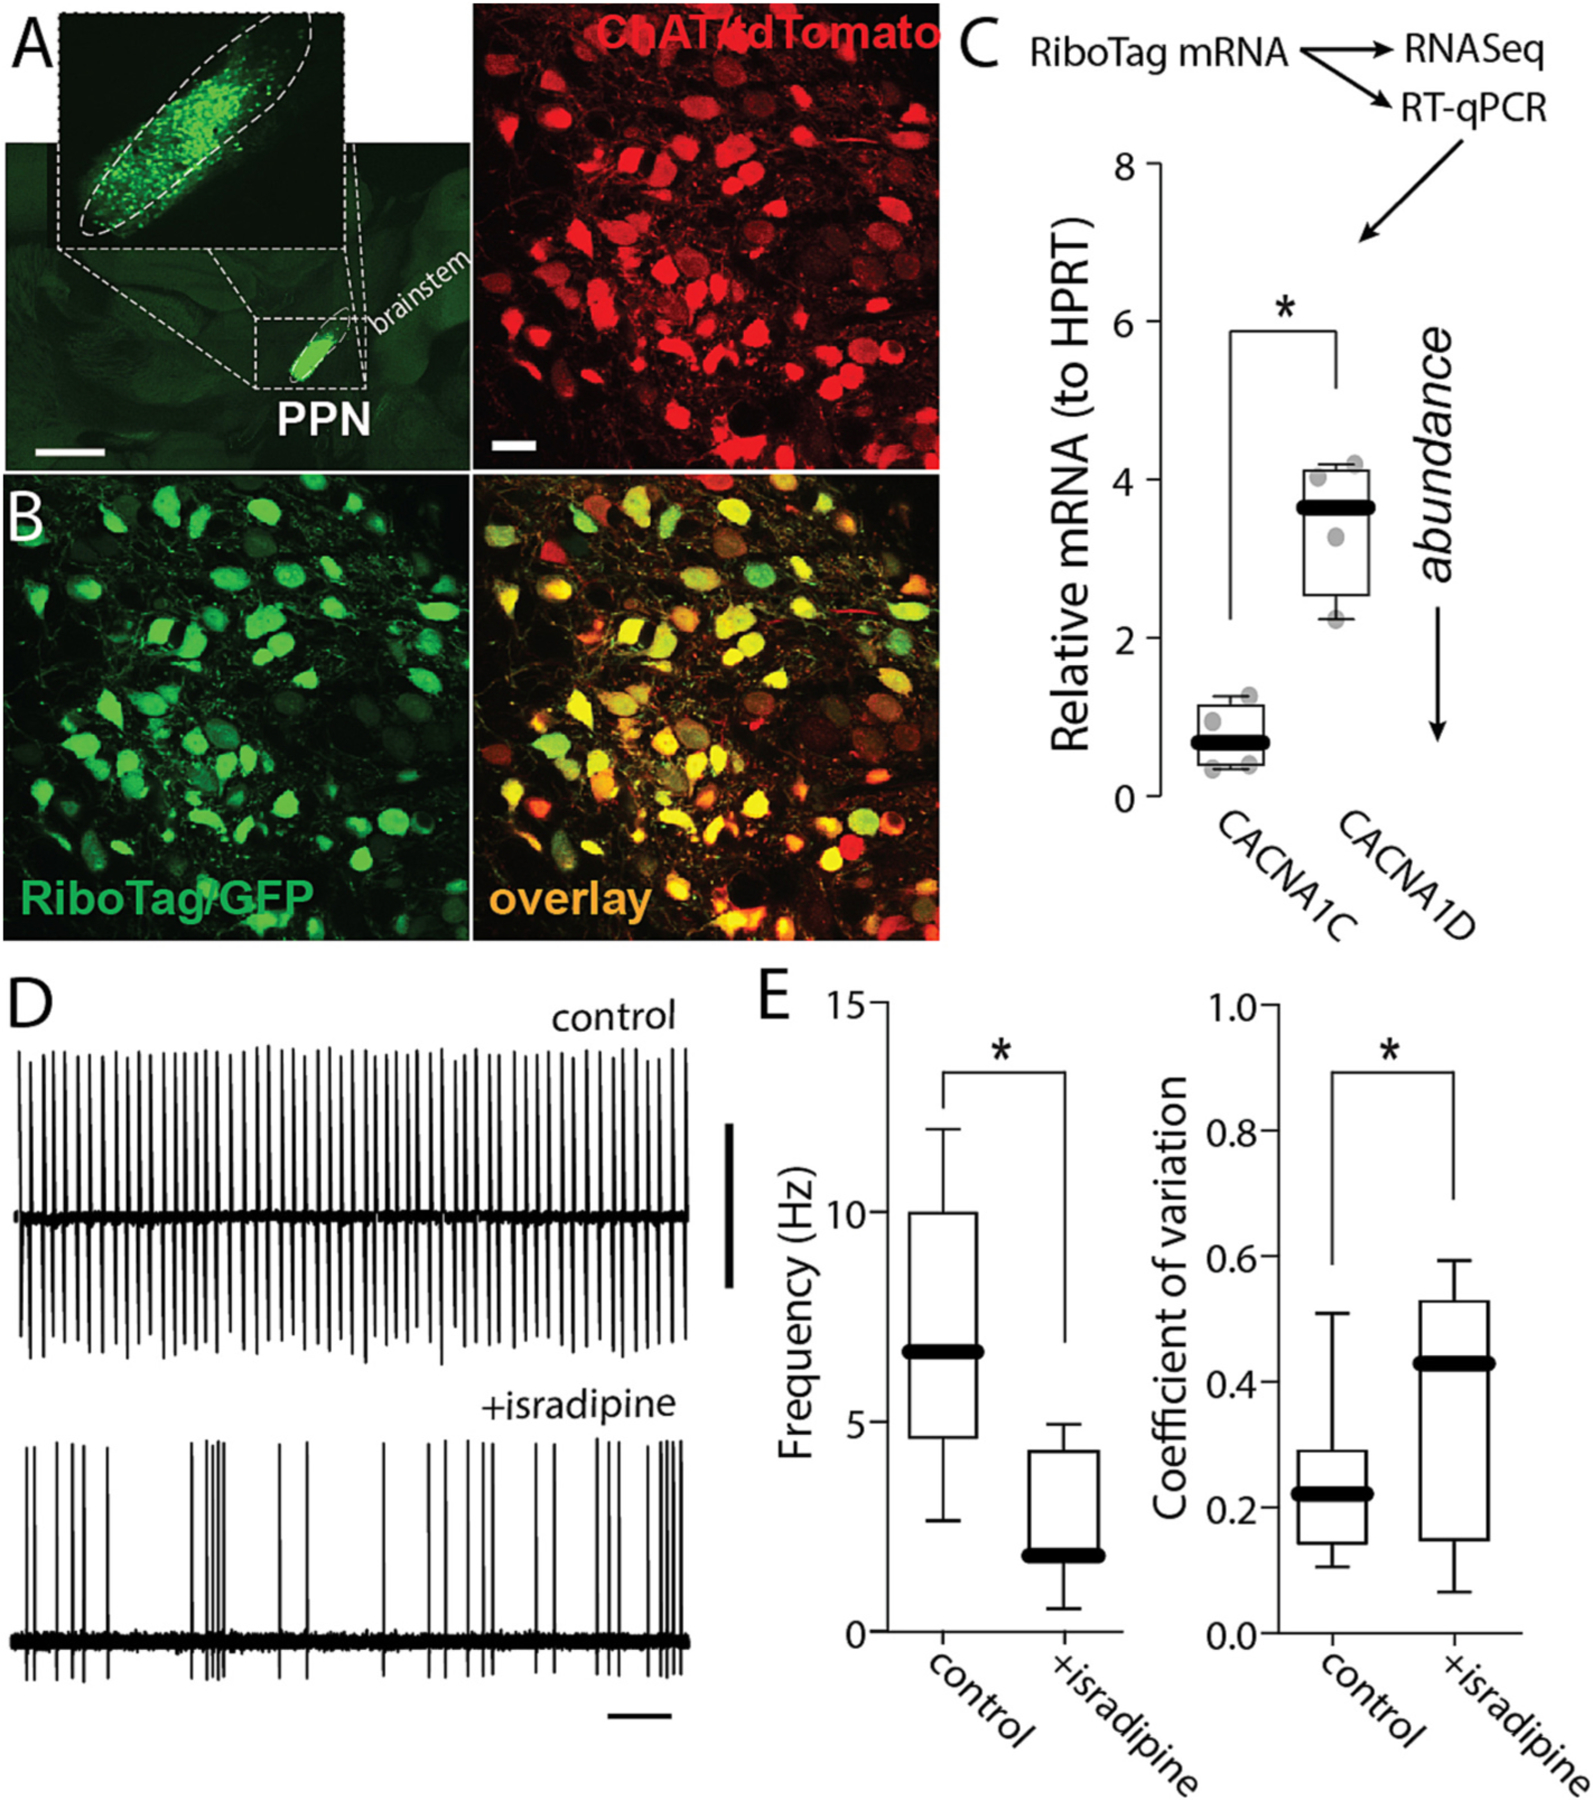
Fig. 2.

Calcium channels expression in PPN-ChNs. A. Representative micrograph of a parasagital section from a ChAT-Cre/Ai14 mouse brain showing RiboTag-GFP expression (green) in the PPN. Bar: 1000 μm. B. Representative micrograph from a ChAT-Cre/Ai14 mouse showing RiboTag-GFP expression (green) in PPN CNs (red). Bar: 20 μm. C. Quantification of RNA abundance of Cav1.2 (CACNA1C) and Cav1.3 (CACNA1D) (t-test; *p = 0.0071; n = 4 mice). D. Representative cell-attached recordings of PPN CNs without or with chronic isradipine (500 nM, 1 h pre-incubation). Vertical bar: 5 mV; horizontal bar: 1 s. E. Firing frequency and coefficient of variation of PPN CNs with or without isradipine (Frequency: Mann-Whitney, *p = 0.0030; coefficient of variation: Mann-Whitney, *p = 0.0016; n = 10–11 in each group). Box plots indicate first and third quartiles, thick center lines represent medians, and whiskers indicate the range.
