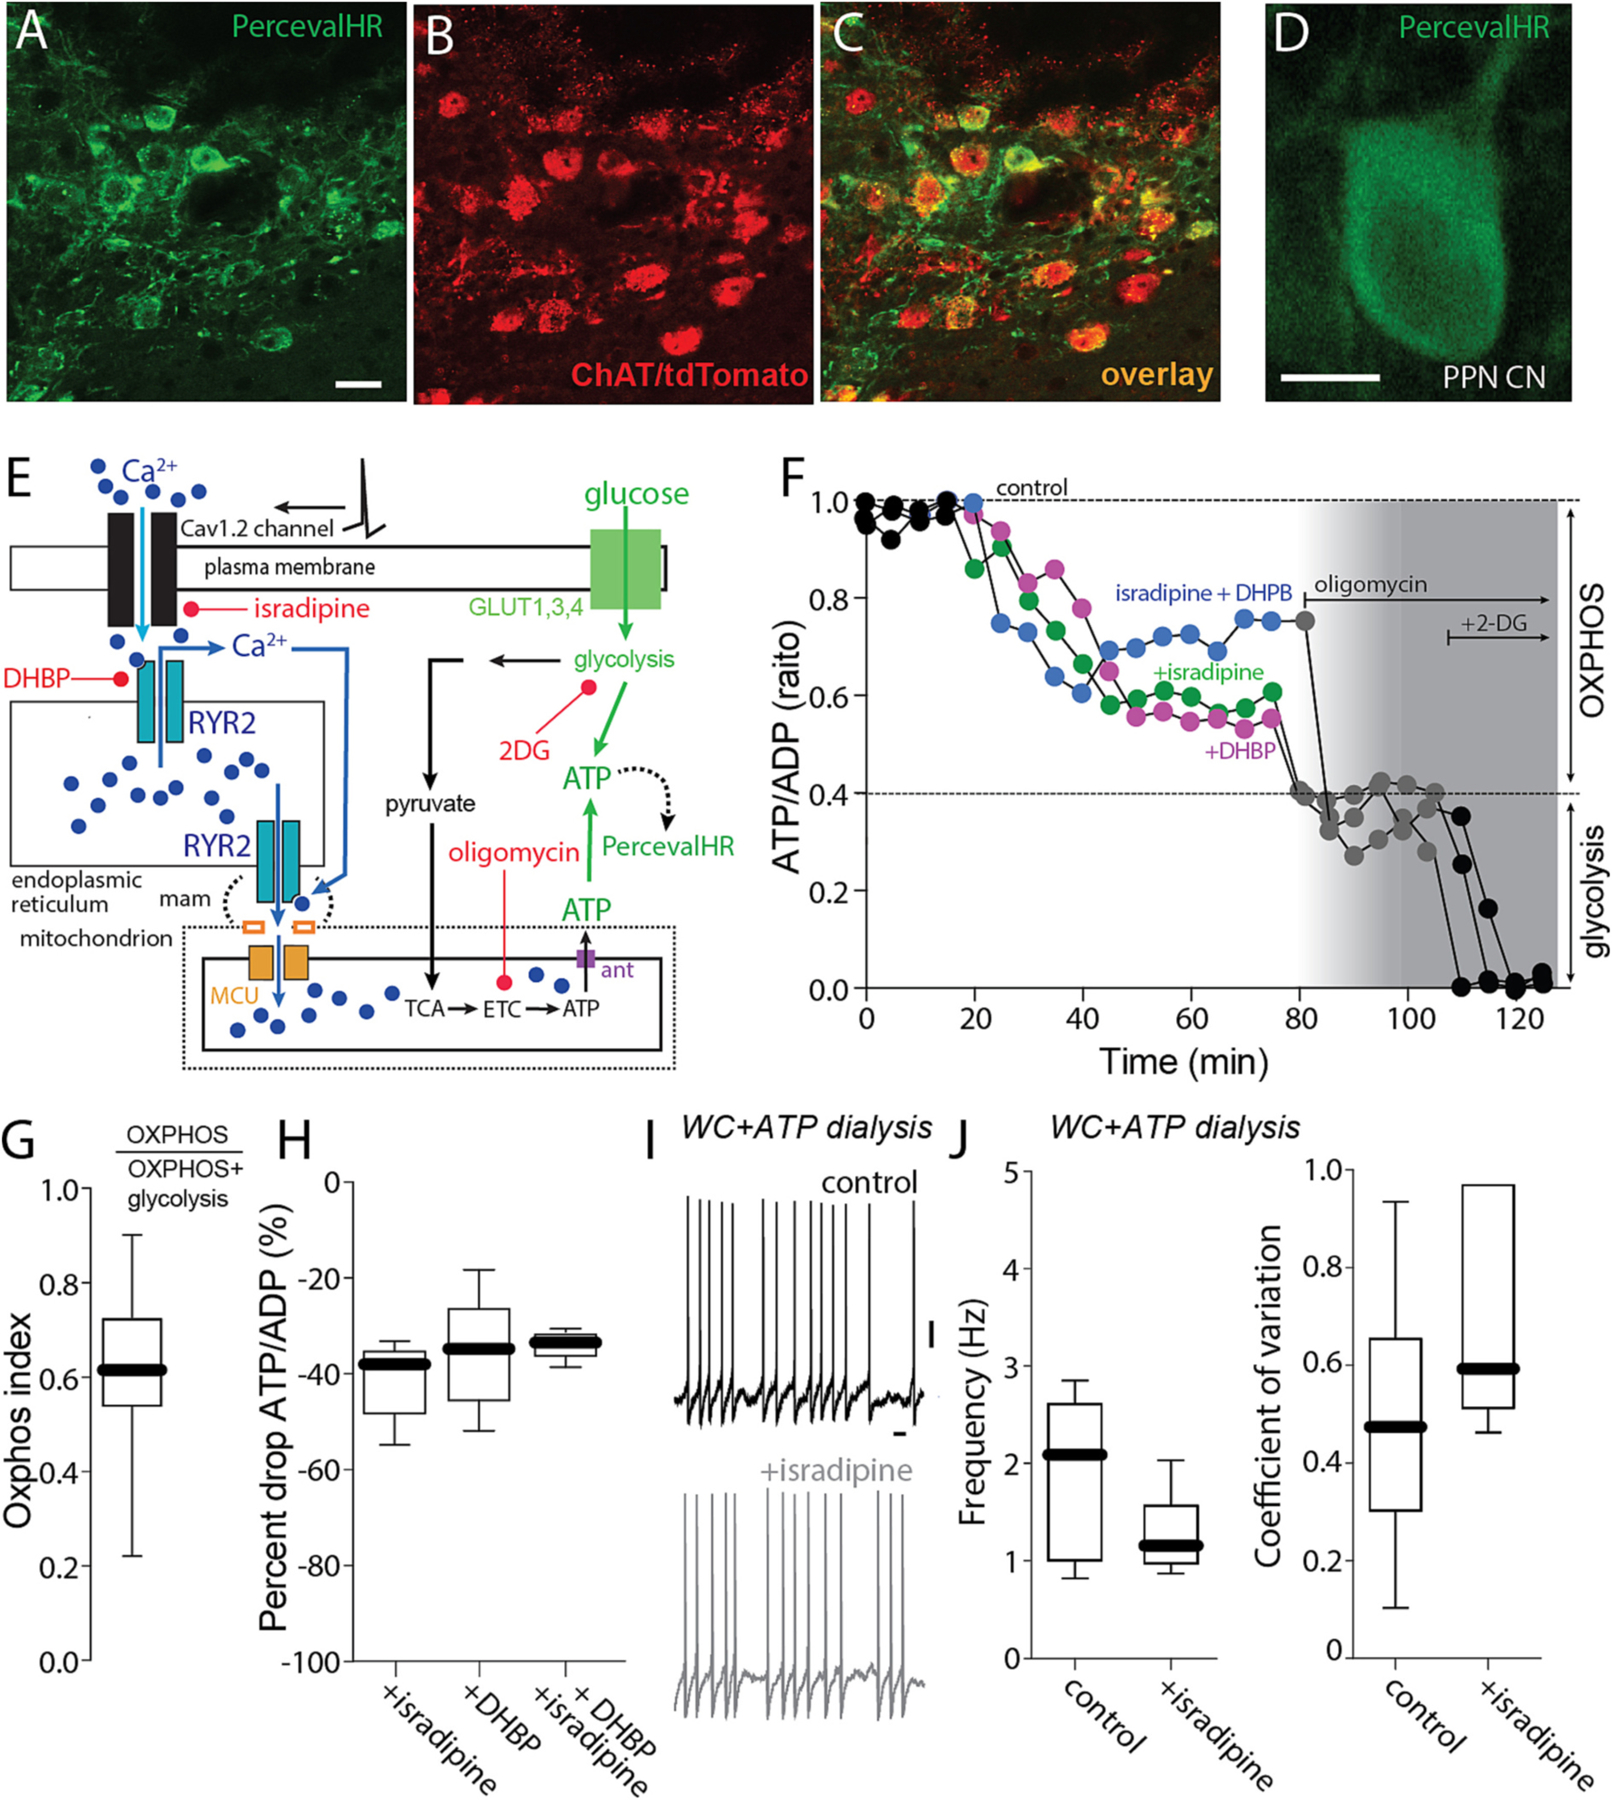
Fig. 5.

Cav1 channels regulate mitochondrial ATP synthesis. A-C. Representative micrograph from a ChAT-Cre/Ai14 mouse showing Perceval expression (green, A) in choline acetyltransferase immunolabeled neurons (ChAT, B) and the overlay of both markers (C). Bar: 20 μm. D. Representative micrograph of a recorded PPN CN expressing the PercevalHR probe. E. Cartoon illustrating the effect of Ca2+ entry through Cav1 channels and RYR Ca2+ release on mitochondrial ATP production and the action of isradipine and DHBP. F. Representative PercevalHR experiment estimating the effect of isradipine (500 nM) and DHBP (100 μM) on the contribution of mitochondria OXPHOS (inhibited by oligomycin) and glycolysis (inhibited by 2-DG) to the ATP/ADP ratio of the cell; the fluorescence measured for each of the two wavelengths (950 for ATP, 820 for ADP) is illustrated. G. Oxphox index of PPN CNs; n = 19H. Percentage of drop of ATP/ADP ratio from ACSF for isradipine, DHBP and both I. Representative whole-cell recordings of PPN CNs without or with chronic isradipine (500 nM, 1 h pre-incubation); n = 6–7 in each group. Bar: 1 s. J. Firing frequency and coefficient of variation of PPN CNs with or without isradipine (frequency: Mann-Whitney, NS; coefficient of variation: Mann-Whitney, NS; n = 5–6 in each group). Box plots indicate first and third quartiles, thick center lines represent medians, and whiskers indicate the range.
