
Fig. 7.
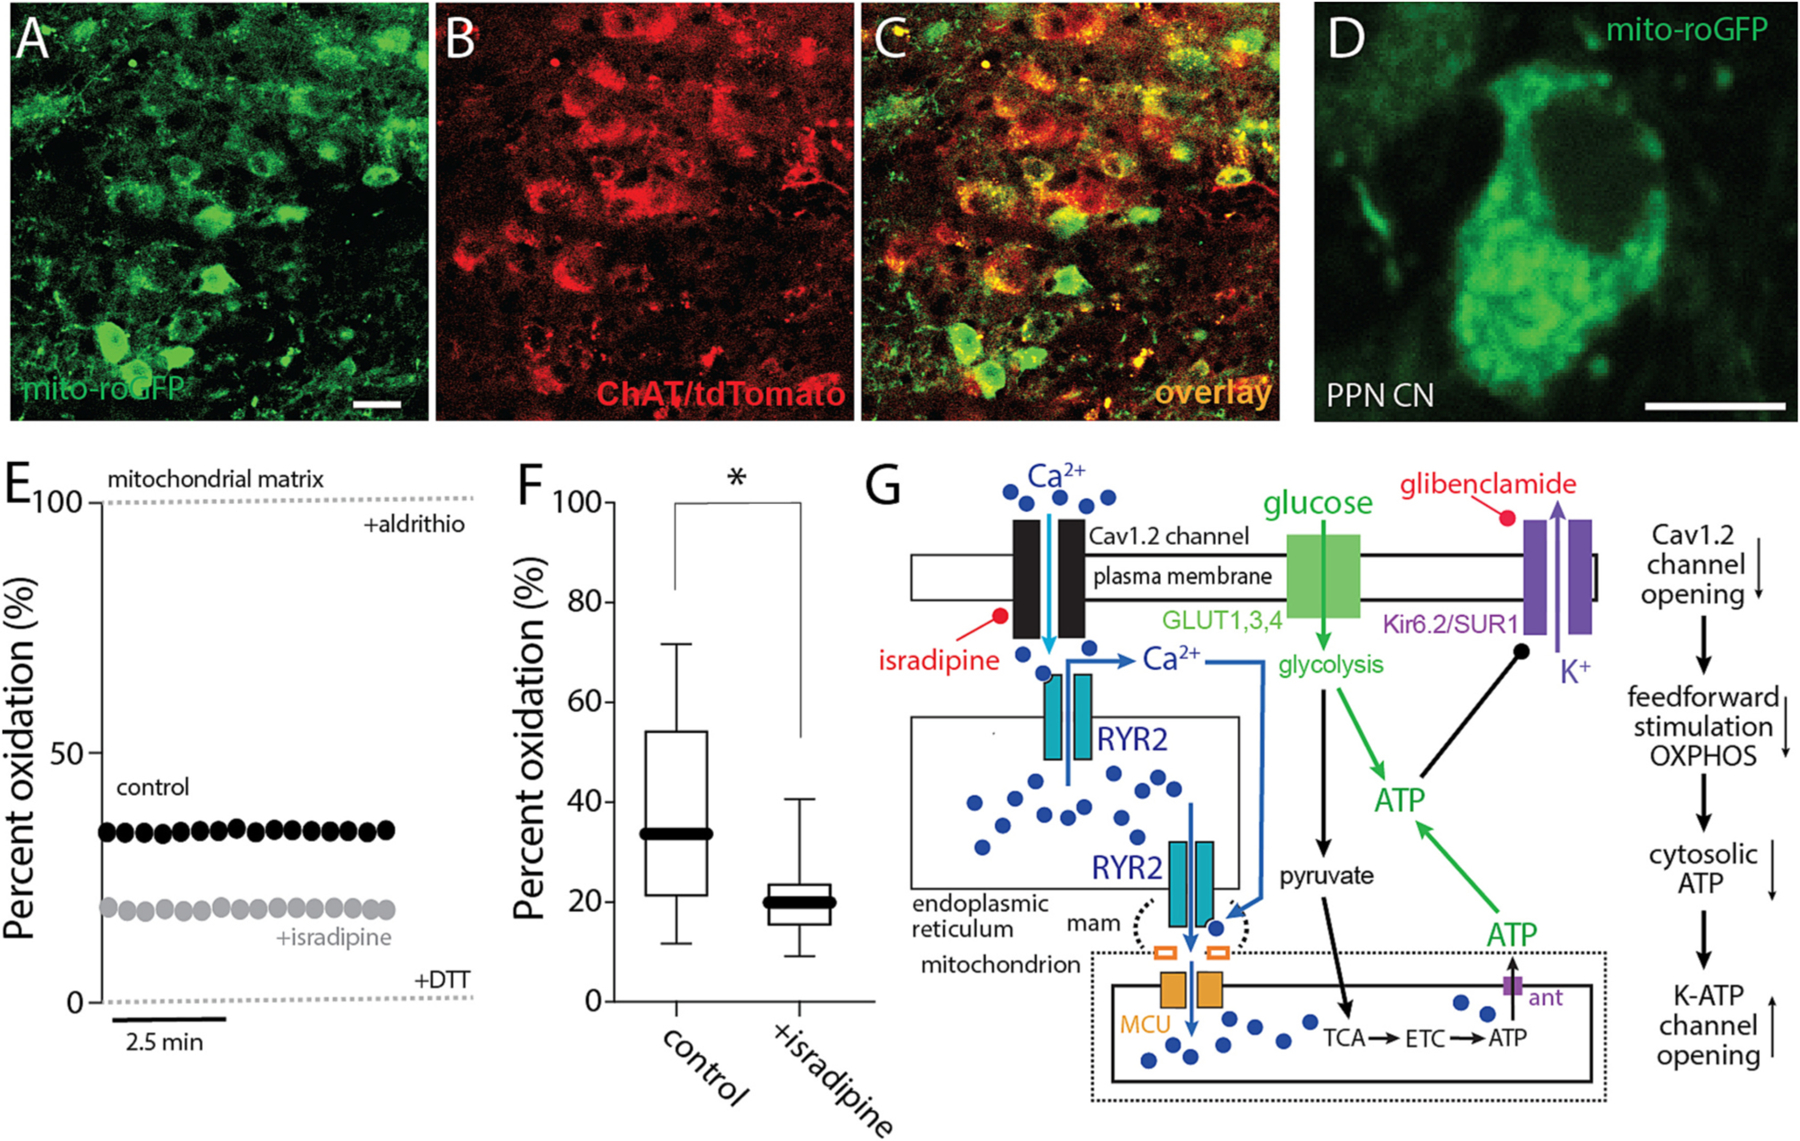
Feed-forward stimulation of mitochondria increased oxidant stress. A-C. Representative micrograph from a ChAT-Cre/Ai14 mouse showing mito-roGFP expression (green, A) in choline acetyltransferase immunolabeled neurons (ChAT, B) and the overlay of both markers (C). Bar: 20 μm. D. Representative micrograph of a recorded PPN CN expressing mito-roGFP. Bar: 10 μm. E. Representative examples of the percentage of oxidation of a PPN CN in control aCSF or with isradipine, expressed as relative oxidation compared to the fully reduced and fully oxidized states obtained upon application of dithiothreitol (DTT; 2 mM) and aldrithiol (Ald; 200 μM), indicated by dashed lines. F. Percentage of oxidation of PPN CNs in the absence or presence of isradipine (Mann-Whitney, *p = 0.0234; n = 12–13 in each group). Box plots indicate first and third quartiles, thick center lines represent medians, and whiskers indicate the range. G. Cartoon summarizing the effect of Ca2+ entry through Cav1 channels and RYR Ca2+ release on ROS generation.