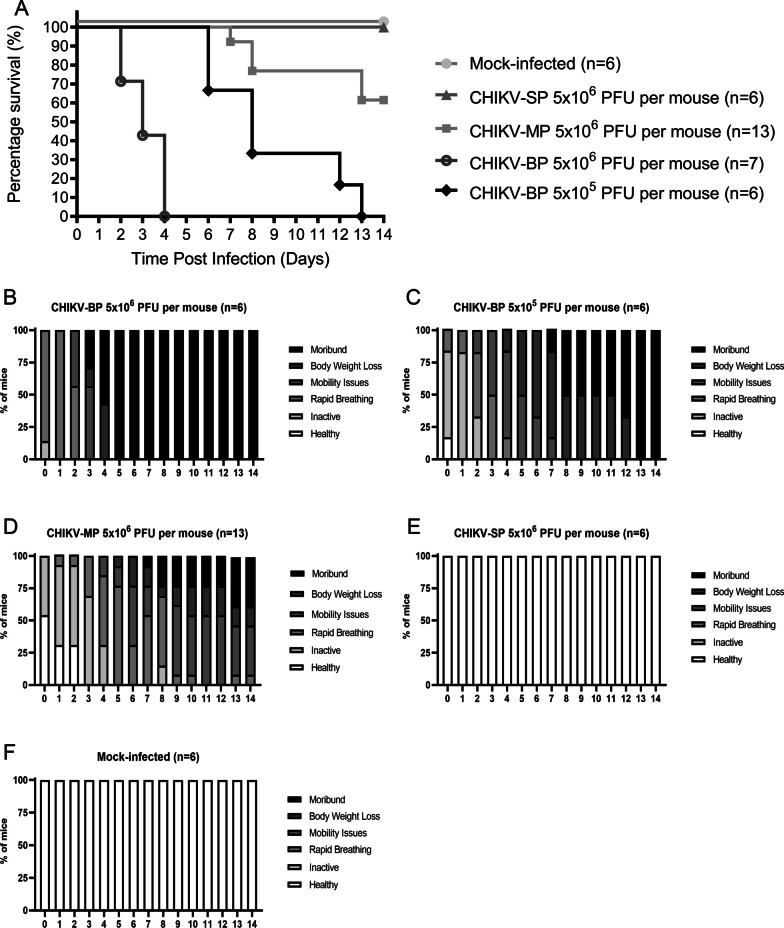
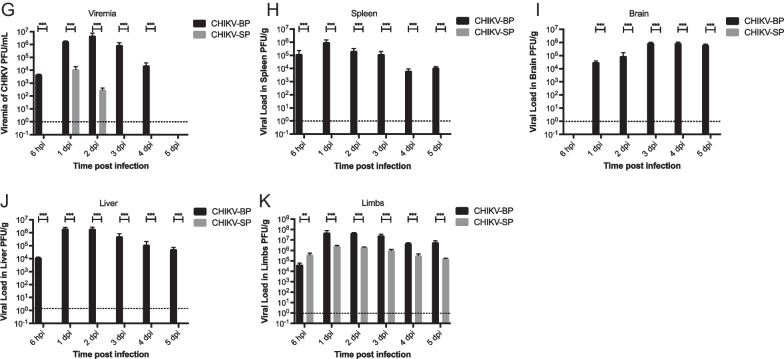
Fig. 2.
Comparison of virulence among various CHIKV variants in 6-day-old BALB/c mice model. A 6-day-old BALB/c mice were intraperitoneally inoculated with CHIKV-SP, CHIKV-BP, CHIKV-MP, or mock-infected. Survival was monitored daily for 14 days post-inoculation, and the data are presented as Kaplan–Meier survival curves. Statistical analysis using the Mantel-Cox test revealed significant differences (P < 0.05) between the survival curves of the CHIKV-infected groups compared to the mock-infected group. B–F Daily assessments of the mice were conducted using a mouse clinical scoring system to evaluate the severity of clinical symptoms induced by CHIKV infection (Additional file 1: Table S1). G–K 6-day-old BALB/c mice were infected with 5 × 10⁵ PFU of CHIKV-SP or CHIKV-BP. At specific time points (6 h.p.i., 1 d.p.i., 2 d.p.i., 3 d.p.i., 4 d.p.i., and 5 d.p.i.), serum, spleen, brain, liver, and limb tissues were collected from a group of 3 to 4 mice per group. The collected tissue samples were homogenized, and the supernatant was used for quantifying the amount of infectious virus particles of CHIKV-BP and CHIKV-SP using viral plaque assay. The dashed line in the figure represents the Limit of Detection (LOD) of the viral plaque assay. The mean values along with individual data points are presented to illustrate the viremia and viral load dynamics in the different tissues over the course of infection


