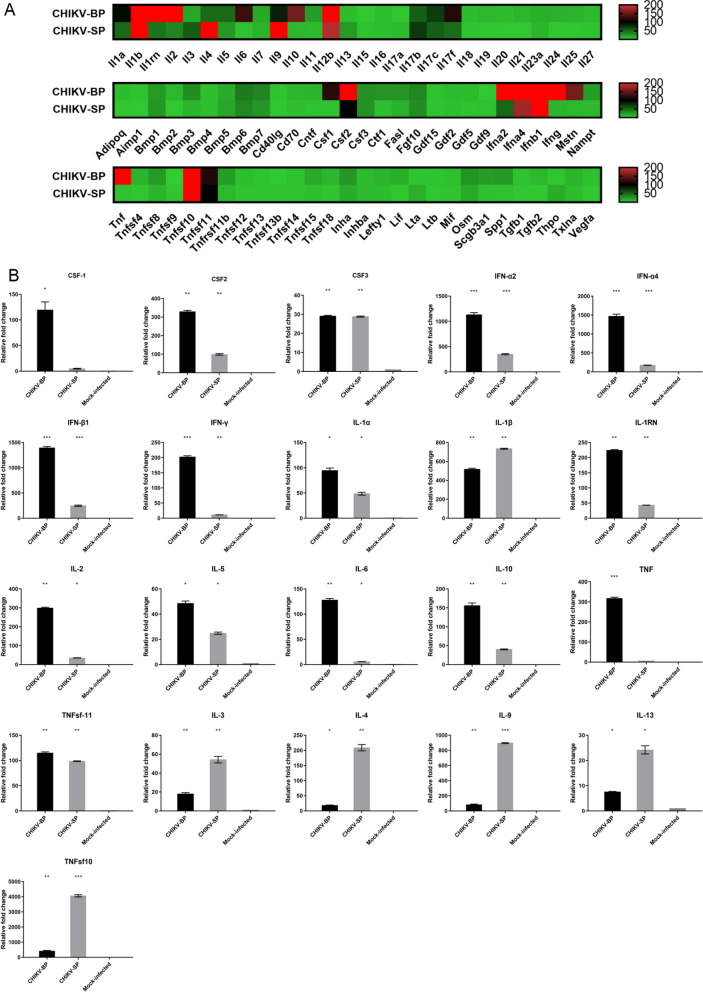
Fig. 4.
Analysis of mouse cytokine gene expression. A Heatmap illustrating the expression of mouse cytokine genes at 2 days post-inoculation with CHIKV-SP (n = 6) or CHIKV-BP (n = 6). High and low gene expression levels are depicted in red and green, respectively. B Cytokines showing significant upregulation in their expressions (≥ twofold change, P < 0.05) in CHIKV-BP or CHIKV-SP-infected mice compared to the mock-infected group (n = 6). Data are presented as mean ± SEM, and statistically significant values are denoted as *P < 0.05, **P < 0.01, ***P < 0.001 (Mann–Whitney U-test). Multiple comparison tests were performed for each group of genes and adjusted against the mock-infected group

