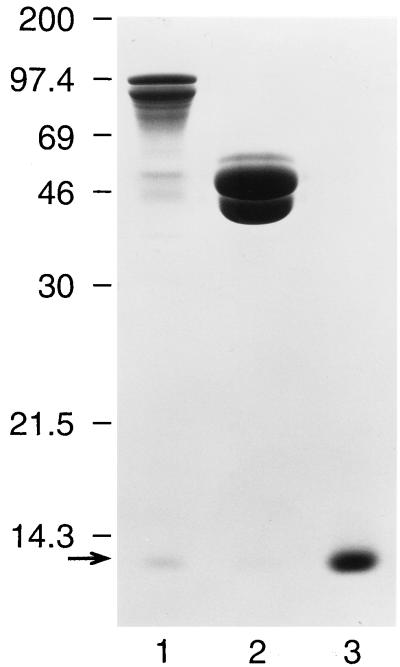
FIG. 1.
Purification of SREHP-H and MBP-H proteins. Shown is a Coomassie blue stain of SDS-PAGE-separated purified SREHP-H (lane 1), MBP-H (lane 2), and CTB (lane 3). A band at approximately 97 kDa, the expected size of the MBP-SREHP-CTA2 fusion protein, and a band at approximately 12 kDa (arrow), the expected size of the CTB protein, are seen in lane 1. A band at 47 kDa, the expected size of the MBP-CTA2 protein, and a band at 12 kDa are seen in lane 2. The low-molecular-mass bands in lanes 1 and 2 can be seen to comigrate with CTB (lane 3). Molecular masses (in kilodaltons) are shown on the left.

