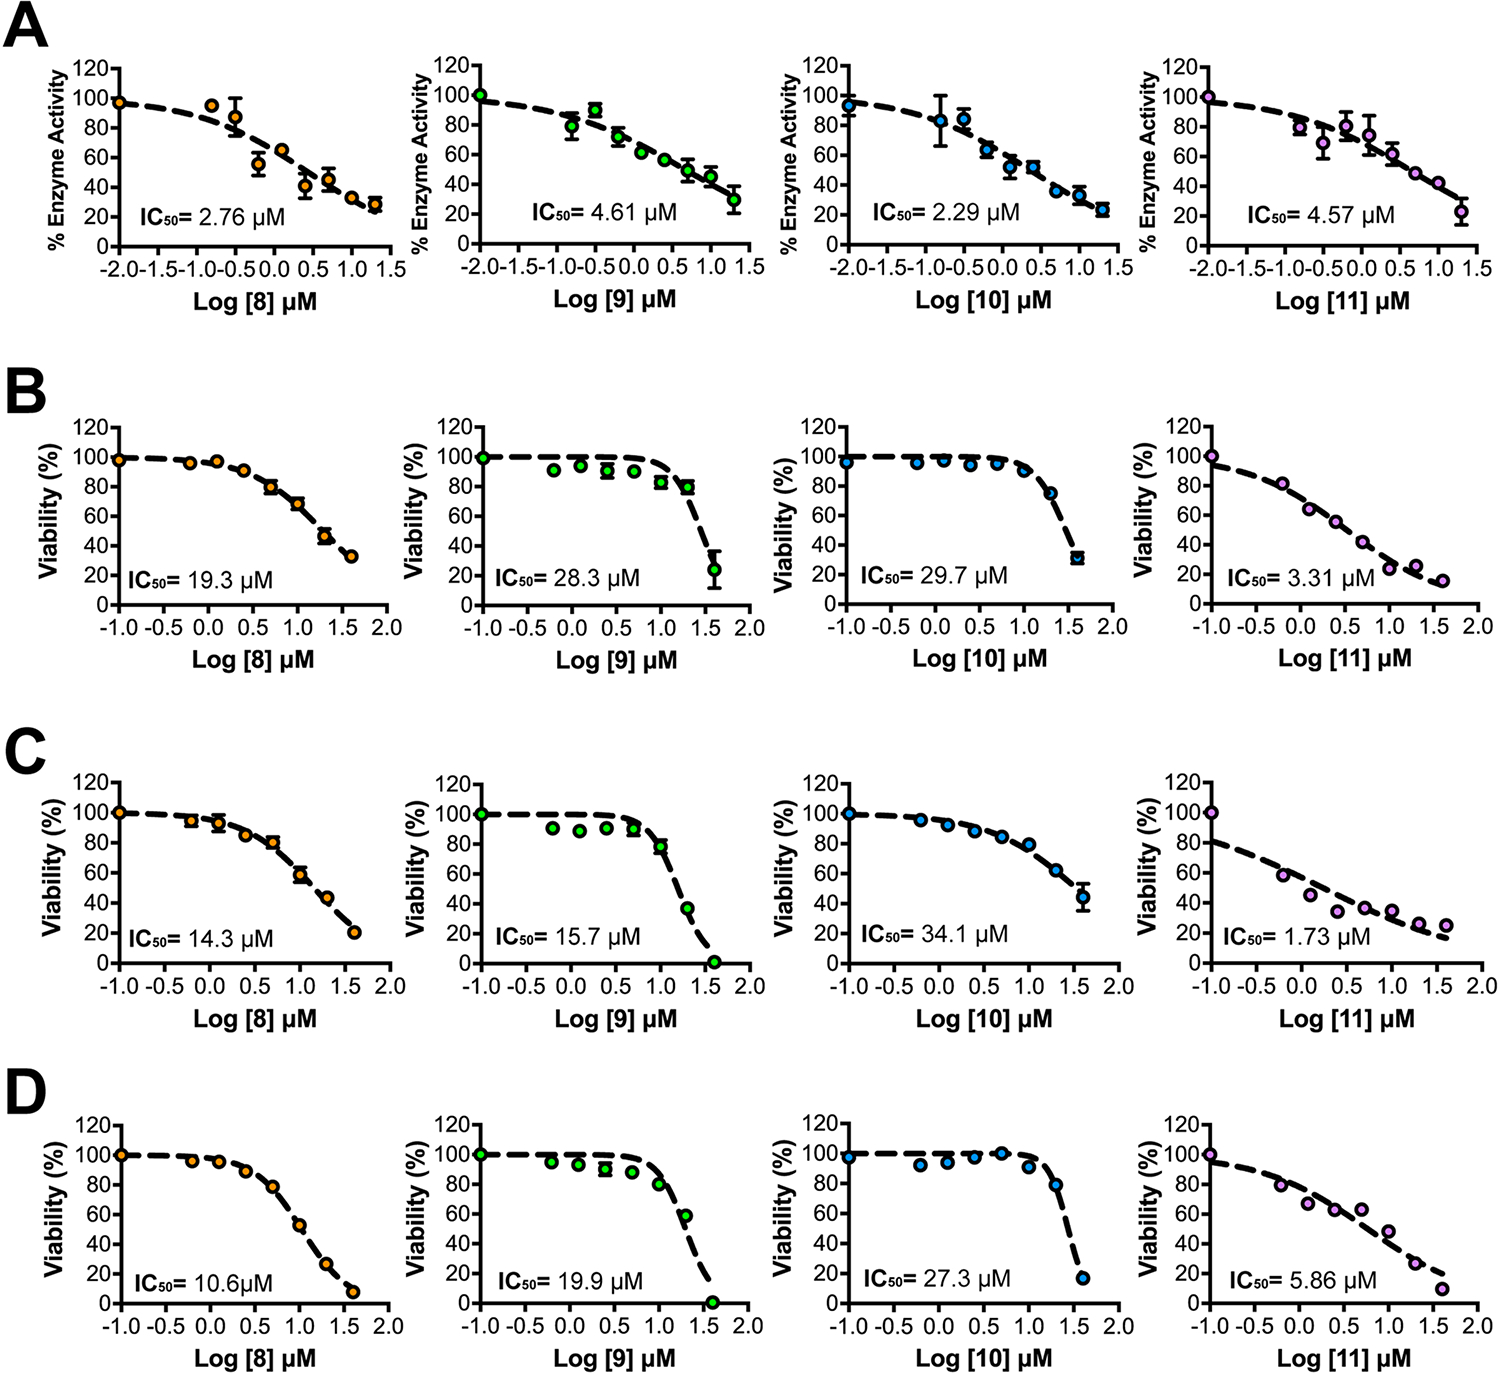
Fig. 2.

Top HTS hits exhibit dose-dependent inhibition of CHD1L and tumor organoid viability. (A) Graphical representation of dose-response inhibition of the cat-CHD1L enzyme by CHD1Li (N = 2). Each data point is averaged from 2 experiments performed in quadruplicate and error bars are the calculated standard error of the mean (SEM). Graphical representation of dose-response cytotoxicity induced by top CHD1Li (N = 3) in (B) SW620-GFP+, (C) SW480, and (D) HCT116 CRC tumor organoids. Each data point is averaged from 3 experiments performed in triplicate and error bars are the calculated standard error of the mean (SEM).
