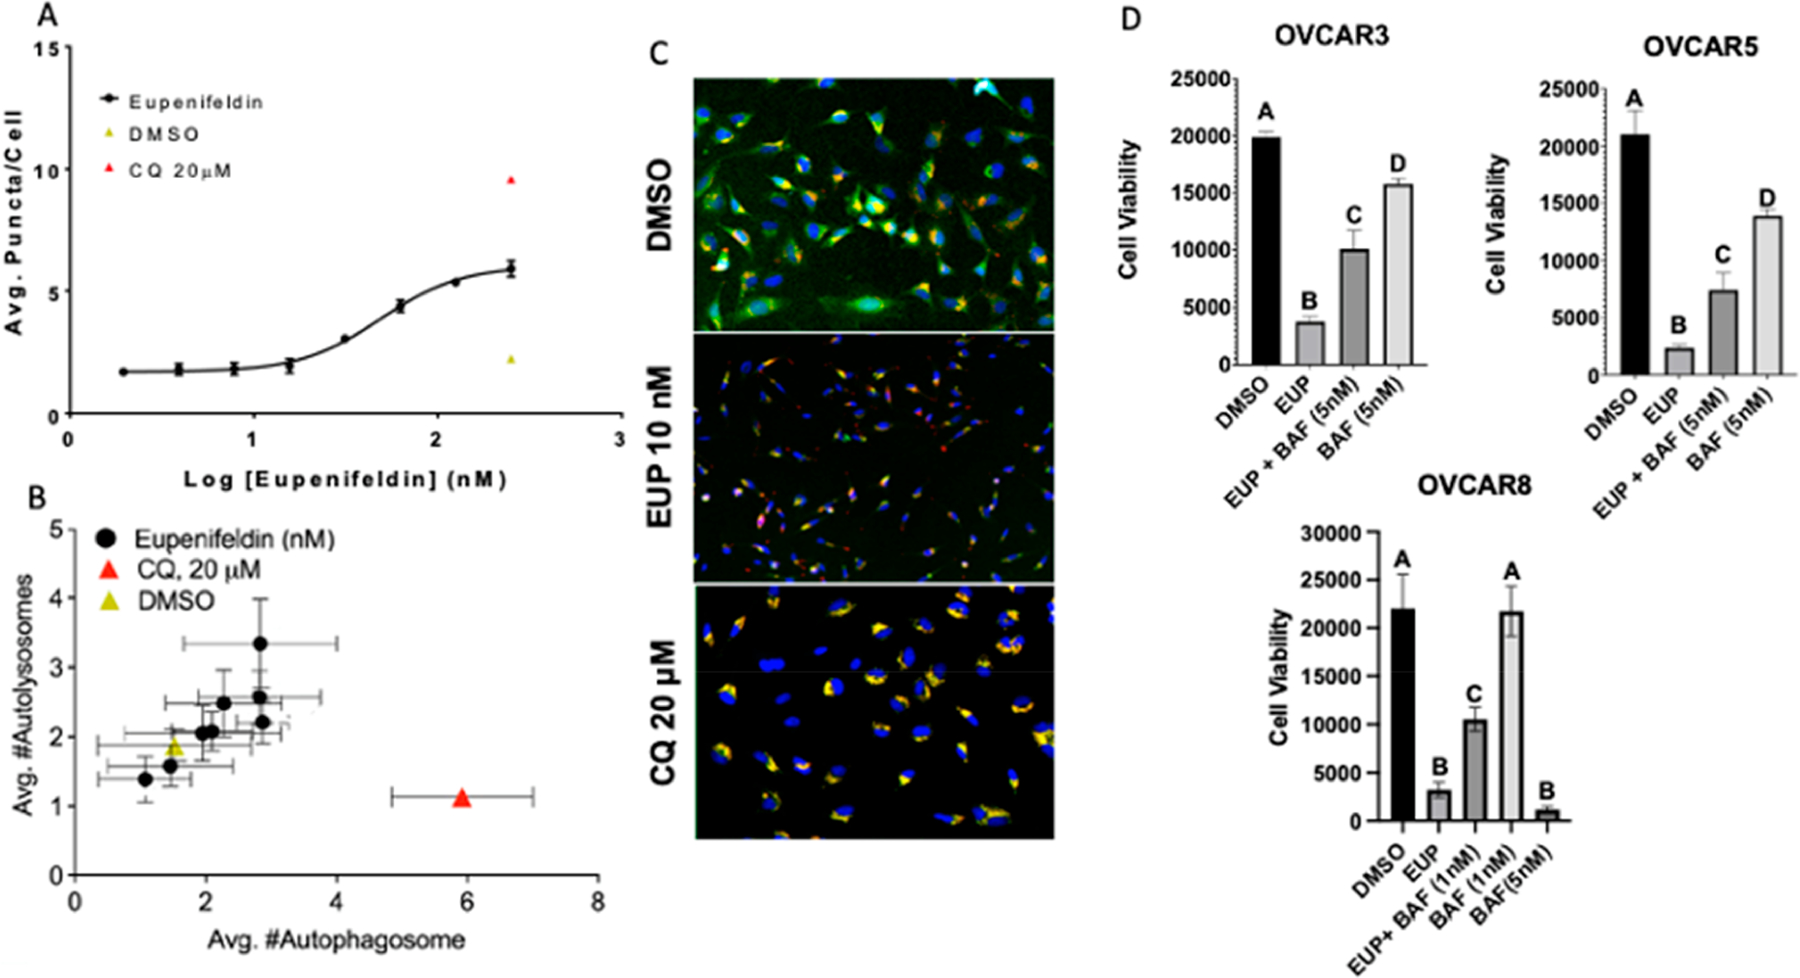
Figure 7.

(A) An increasing number of LC3 puncta per HeLa cell were observed with increasing eupenifeldin treatment. All treatments were normalized to the vehicle (DMSO). (B) Autophagic flux assay demonstrates weak induction of autophagy by eupenifeldin. All treatments were normalized to vehicle (DMSO). Autophagy data represent mean ± SEM and three biological replicates, each in duplicate. (C) Representative images of B taken at 10× showing puncta formation indicative of autolysosome formation compared to the late-stage autophagy inhibitor CQ, which induces an accumulation of autophagosomes. (D) Bafilomycin cotreatment shows partial rescue of eupenifeldin-induced cytotoxicity. Data represent mean ± SEM and three biological replicates. Significance was determined with two-way ANOVA with Tukey’s post hoc. Letters represent significantly different treatments, p < 0.05.
