Figure 2.
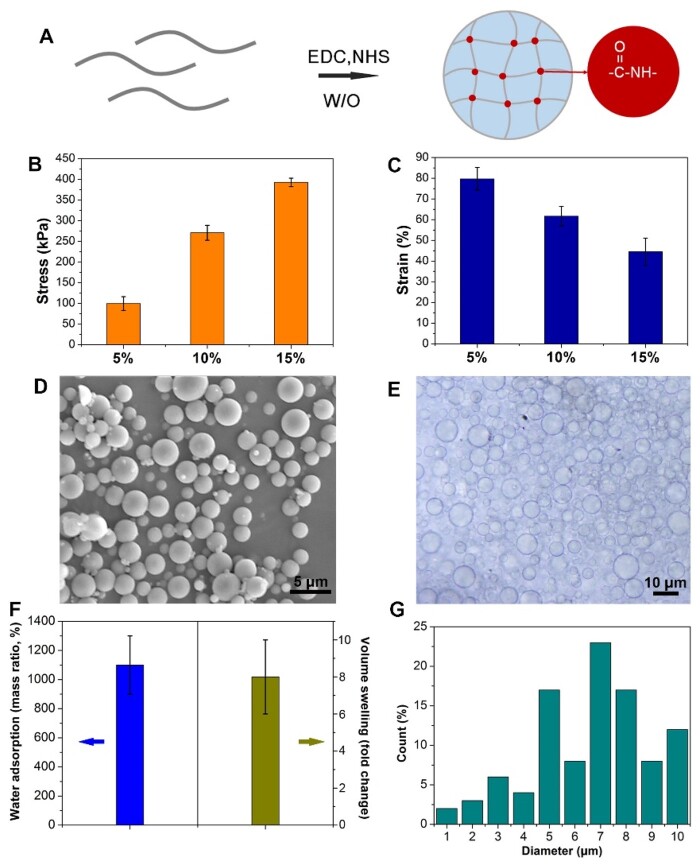
Gelatin microspheres preparation. (A) Schematic diagram of gel crosslinking. (B) Maximum failure stress of bulk gelatin hydrogels with different gelatin concentration in compression test. (C) Maximum failure strain of bulk gelatin hydrogels with different gelatin concentration in compression test. (D) The SEM image microsphere (bar scale = 5 μm). (E) The wet microspheres observed by phase-contrast microscope (bar scale = 10 μm). (F) Swelling behavior of the microspheres. (G) The diameter statistics.

