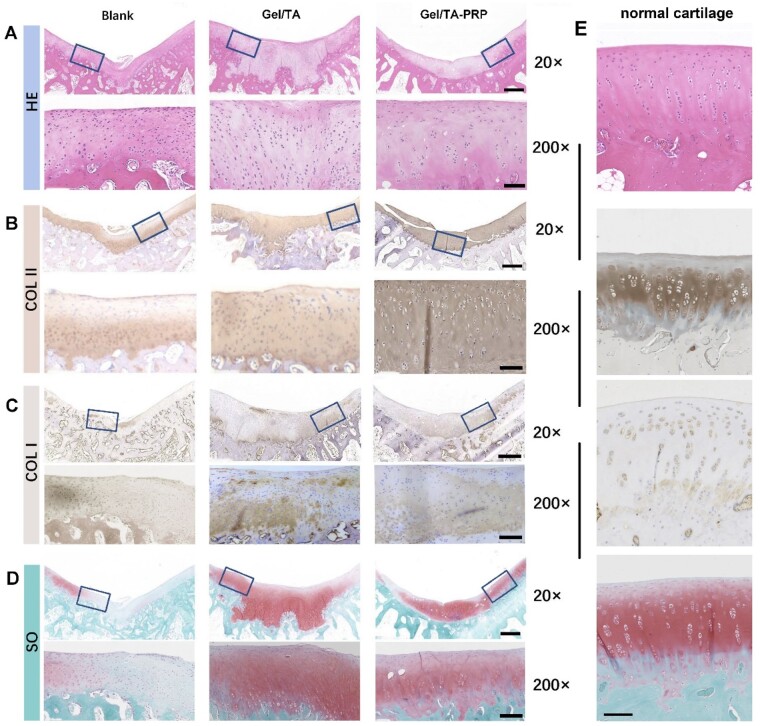
Figure 7.
Histological evaluation on samples of different groups at 8 weeks in vivo. (A) H&E staining. (B) COL II immunohistochemistry staining. (C) COL I immunohistochemistry staining. (D) Safranin O-Fast Green staining. (The scale of a 20× enlarged image was 600 μm; the scale of a 200× enlarged image was 100 μm.) (E) H&E staining, COL II immunohistochemistry staining, COL I immunohistochemistry staining, Safranin O-Fast Green staining of the normal cartilage (the scale was 100 μm).

