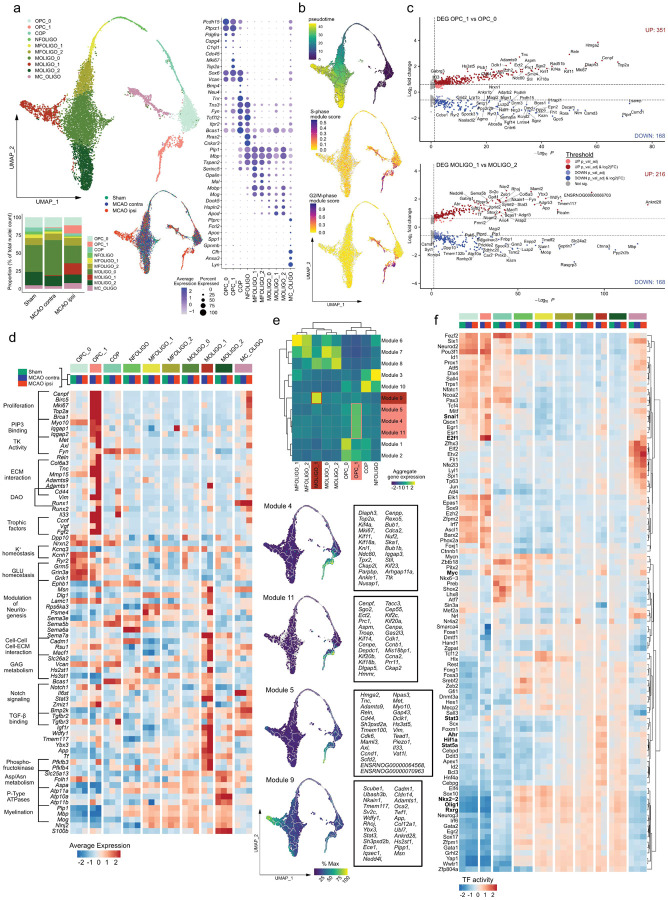
Figure 2. Emergence of transcriptionally distinct OPCs and mature oligodendrocytes within infarcted brain tissue.
(a) Subclustering of oligodendrocyte lineage clusters. Top left: UMAP plot depicting 10240 nuclei annotated to 10 subclusters, bottom left: stacked bar plot depicting the relative abundance of each subcluster within each group, bottom right: Nuclei distribution coloured by treatment group, right panel: dotplot depicting curated sub cluster markers. Subcluster abbreviations: OPC: oligodendrocyte precursor cell, COP: committed oligodendrocyte precursor, NFOLIGO: newly formed oligodendrocyte, MFOLIGO: myelin forming oligodendrocyte, MOLIGO: mature oligodendrocyte, MC_OLIGO: myeloid cell oligodendrocyte mixed cluster. (b) Top: Projection of Monocle3 generated pseudotime trajectory onto subcluster UMAP plot, with subcluster OPC_0 as root. Feature Plots depicting S-phase (middle) and G2/M-phase (bottom) gene module scores. (c) Volcano plots depicting DEGs derived from the comparison of clusters OPC_1 to OPC_0 (top) and MOLIGO_1 to MOLIGO_2 (bottom). (d) Heatmap depicting the average scaled gene expression of curated DEGs, split by subcluster and treatment group. Functional annotations are given on the left side of the gene names. (e) Top: Clustered heatmap depicting aggregate gene expressions of Monocle3 derived co-regulated gene modules. Modules associated to OPC_1 and MOLIGO_1 are highlighted in light and dark red, respectively. Bottom: The average aggregate expression of the OPC_1 and MOLIGO_1 associated modules is plotted along the pseudo time trajectory. The Top 25 module defining genes, as sorted by descending Morańs I, are depicted in boxes on the right side of the respective gene module feature plots. (f) Heatmap depicting the top 100 most variable decoupleR derived transcription factor activities, within the oligodendrocyte lineage sub clustering analysis, split by sub cluster and treatment group.

