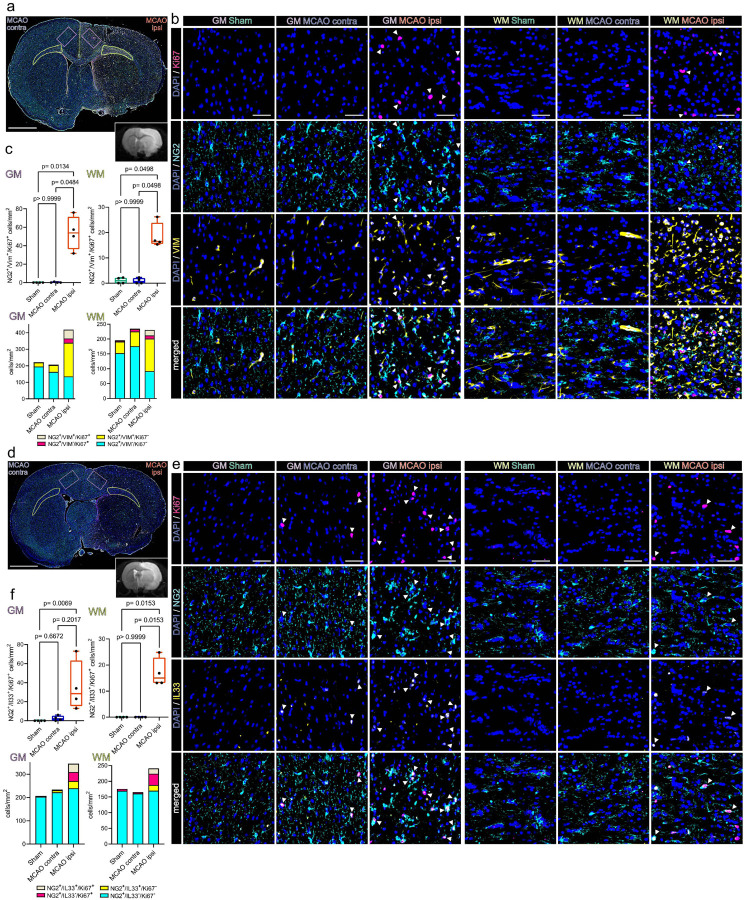
Figure 3. Proliferating OPCs accumulate in the perilesional zone 48 h after ischemic stroke and express VIM and IL33.
(a) Overview of a representative coronal brain section 48 h post MCAO, stained for NG2, VIM and Ki67. Grey matter ROIs (GM) are highlighted in violet, white matter ROIs (WM) in lime green, lower right inset depicts a corresponding T2 weighted MRI image from the same animal. Bar = 2 mm (b) Representative images from GM and WM ROIs of Sham, MCAO contra and MCAO ipsi sections, split by antigen. Ki67 = magenta, NG2 = Cyan, VIM = yellow, DAPI (nuclei) = blue, bars = 50 μm. White arrowheads point to triple positive cells. (c) Cell counts within GM and WM respectively are presented as box plots for NG2+/VIM+/Ki67+ triple positive cells. Cell counts for NG2+/VIM+/Ki67+, NG2+/VIM−/Ki67+, NG2+/VIM+/Ki67−, NG2+/VIM−/Ki67− are also jointly shown as colored stacked bar plot. (d) Representative coronal overview, 48 h post MCAO, stained for NG2, IL33, Ki67. GM ROIs in violet, WM ROIs in lime green, lower right inset shows a corresponding MRI image from the same animal. Bar = 2 mm (e) Representative images from GM and WM ROIs derived from Sham, MCAOcontra and MCAOipsi groups, split by antigen. Ki67 = magenta, NG2 = Cyan, IL33 = yellow, DAPI (nuclei) = blue, bars = 50 μm White arrowheads point to triple positive cells. (f) Cell counts within GM and WM are presented as box plots for NG2+/IL33+/Ki67+ triple positive cells. Cell counts for NG2+/IL33+/Ki67+, NG2+/IL33−/Ki67+, NG2+/IL33+/Ki67−, NG2+/IL33−/Ki67− are also jointly shown as colored stacked bar plot. Data derived from n = 4–5 animals per group, p values derived from Kruskal-Wallis-H-Tests, followed by Dunn’s post hoc comparisons.

