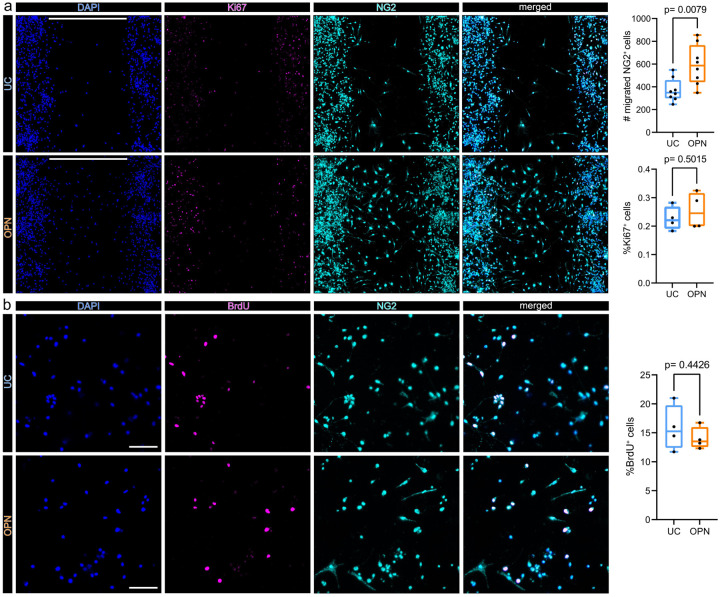
Figure 7. Osteopontin induces OPC migration but not proliferation in vitro.
(a) In vitro cell migration assay. Cells were seeded in 2 well culture inserts, creating defined 500 μm gaps. NG2 positive cells which migrated into the 500 μm gap were quantified after 48 h of treatment. Representative images of OPC cell cultures 48 h after incubation without (upper panel: untreated control = UC), or with 1 μg/ml OPN (lower panel), stained for DAPI (nuclei) = blue, Ki67 = magenta and NG2 = cyan, split by channel. Scale bars denote 500 μm gaps. Box plots on the right show the number of NG2 positive cells, which migrated into 500 μm gaps, for each condition, p-values derived from unpaired studentś t-test (t=3,097, df=14, n=8 replicates per group, from 2 independent experiments). In n = 4 replicates per group from 2 independent experiments Ki67 was visualized. Lower Boxplot depicts the percentages of Ki67+ cells within the 500 μm gap, for each condition, p values derived from unpaired studentś t test (t=0,7150, df=6). (b) BrdU incorporation assay. BrdU incorporation was visualized 24h after incubation without (UC) (upper panel) or with 1 μg/ml OPN (lower panel). Representative 20x magnification images are shown, stained for DAPI (Nuclei) = blue, BrdU = magenta and NG2 = cyan, split by channel. Scale bars = 100 μm. Boxplot depicts the percentages of BrdU+ cells, for each group, p values derived from unpaired studentś t-test (t=0,8219, df=6, n=4 replicates per group, from 1 independent experiment).

