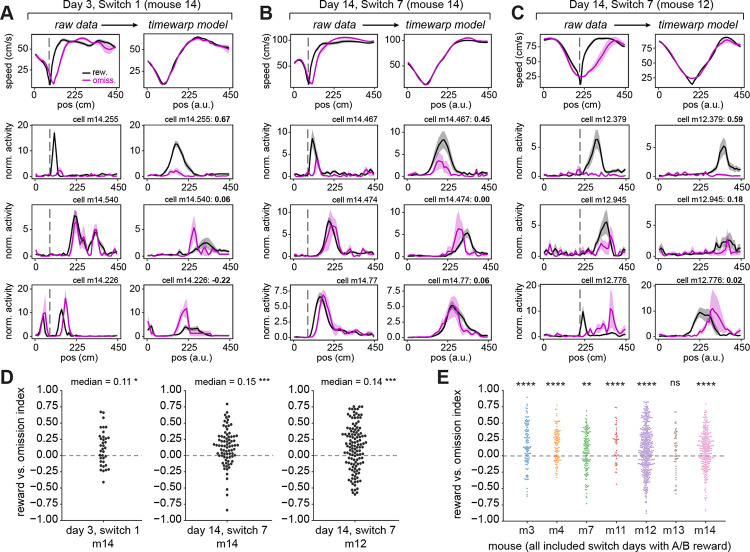
Figure 5. Diversity in reward-relative cell coding on rewarded vs. omission trials, with a population preference for reward.
A) Raw and time warp model-aligned speed (first row) and neural activity for 3 reward-relative example cells (second to fourth rows) on the first switch day, in mouse 14. Throughout Fig. 5, analysis is performed only on trial sets before the reward switch which have at least 3 omission trials. In (A-C), the left columns show raw (untransformed) data, with the start of the reward zone indicated by the gray dashed line. The right columns show data transformed by the time warp model fit to the trial-by-trial speed in that session (see Methods, Fig. S5). All included cells have peak firing following the start of the reward zone. First row: mean ± s.e.m. speed profiles for rewarded (black) and omission (magenta) trials. Note precise alignment of the transformed speed profiles on the right. Second to fourth rows: mean ± s.e.m. deconvolved activity for rewarded and omission trials, normalized to each cell’s mean within the session, showing an example reward-relative cell in each row. The difference in model-transformed activity between rewarded and omission trials is captured as a “reward vs. omission” index (bold text, top right of each panel; see Methods). The top row highlights neurons with much higher activity on rewarded trials. A positive index indicates higher activity on rewarded trials, a negative index indicates higher activity on omission trials.
B) Raw and time warp model-aligned speed and neural activity for 3 reward-relative example cells on the last switch day, in mouse 14. Note cell m14.474 is also shown in Fig. 2B.
C) Raw and time warp model-aligned speed and neural activity for 3 reward-relative example cells on the last switch day, in mouse 12. Note that speed is still aligned well with the reward zone at position “B” (at 220 cm) for m12 vs. position “A” (at 80 cm) for m14. Note cell m12.379 is also shown in Fig. 2B.
D) Reward vs. omission index for the population of reward-relative cells that have spatial firing peaks following the start of the reward zone, in the session shown in (A) (left), (B) (middle), and (C) (right). Each dot is a cell. *p<0.05, ***p<0.001, one-sample Wilcoxon signed-rank test against a 0 median. Switch 1, m14: W = 183, p = 0.018, n = 36 cells; Switch 7, m14: W = 721, p = 2.69e-5, n = 79 cells; Switch 7, m12: W = 2358, p = 3.70e-4, n = 122 cells.
E) Reward vs. omission index across all switch days where the reward zone was at “A” or “B”, for the population of reward-relative cells that have spatial firing peaks following the start of the reward zone within each mouse (n = 7 mice). Each dot is a cell, colors correspond to individual mice. Significance level is set at p<0.007 with Bonferroni correction. **p<0.007, ****p<0.0001. m3: median = 0.14, W = 1.50e3, p = 4.66e-7, n = 3 days, 114 cells; m4: median = 0.20, W = 1.03e3, p = 5.93e-10, n = 3 days, 112 cells; m7: median = 0.09, W = 4.44e3, p = 2.08e-3, n = 4 days, 157 cells; m11: median = 0.23, W = 194, p = 5.32e-5, n = 4 days, 48 cells; m12: median = 0.09, W = 3.41e4, p = 4.40e-8, n = 5 days, 441 cells; m13: median = 0.09, W = 523, p = 0.13, n = 3 days, 52 cells; m14: median = 0.11, W = 1.39e4, p = 3.74e-8, n = 4 days, 296 cells. See also Figure S5.

