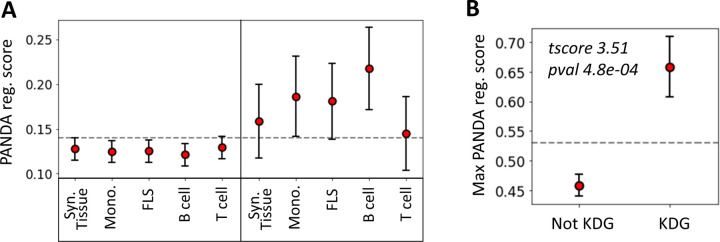
Figure 5:
Relationship between key driver analysis (KDA) and PANDA network-based TF analysis. (A) Average PANDA score of TFs identified as key driver genes (KDA score > 2) and not identified by the KDA analysis (KDA score ≤ 2) for each tissue type. (B) Max PANDA score (defined as the maximum PANDA score across all cell types) for both key driver TFs (KDA score > 2) and non-key drivers (KDA score ≤ 2). The gray line represents the expected score if all TFs were randomly scored, and the error bars correspond to the 95% confidence intervals, defined as .

